
XRP continues to coil within a tight range, holding the crucial $2 area as traders debate whether the token is preparing for a long-awaited expansion phase.
The chart shows a steady pattern of sideways consolidation, marked by repeated attempts to break higher but without any significant loss of structural support. This behavior aligns with what several analysts describe as a “final compression” before a decisive move.
A Long Base and a Pattern That Refuses to Break
Analyst EGRAG highlighted a key observation: XRP’s structure resembles the early stages of a repricing phase. The chart shows a broad accumulation range extending across many months, with price repeatedly rejecting deeper breakdowns.
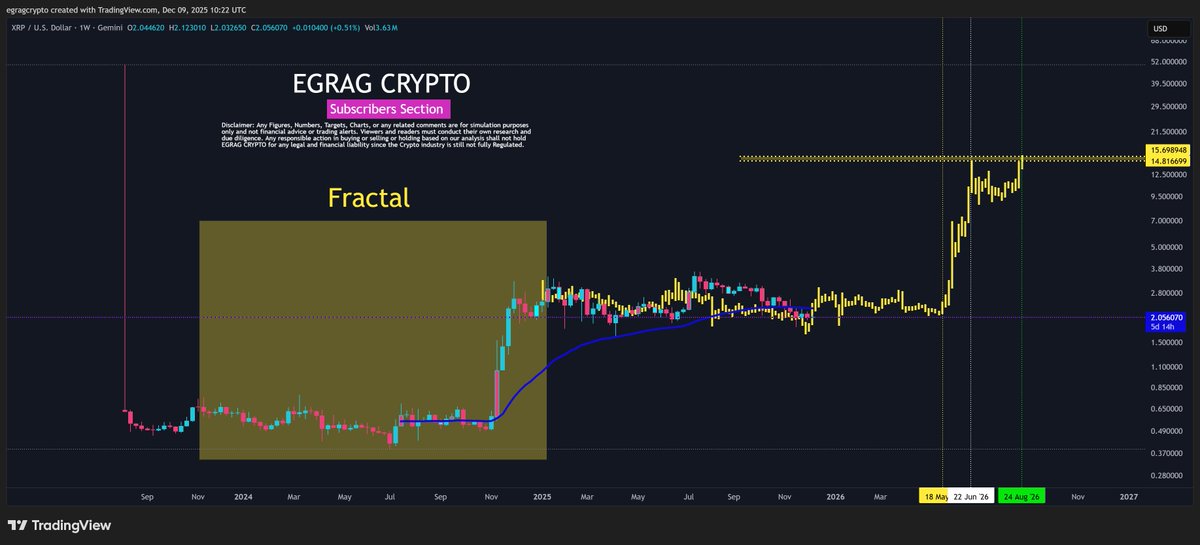
According to EGRAG, this is the type of behavior that usually comes before a major expansion, not after.
He notes three simple phases often seen in XRP’s long-term cycles:
- •Accumulation – likely completed
- •Expansion – potentially ahead
- •Timing – aligned with the mid-2025 to 2026 extended crypto cycle
Within this framework, targets between $7, $12, and even $15 appear less speculative when zooming out. The longer-term fractal projection shows a structured buildup that historically preceded sharp upside repricing events.
What the Chart Reveals Right Now
The TradingView chart shows XRP trading around $2.06, moving inside a tight, low-volatility band.
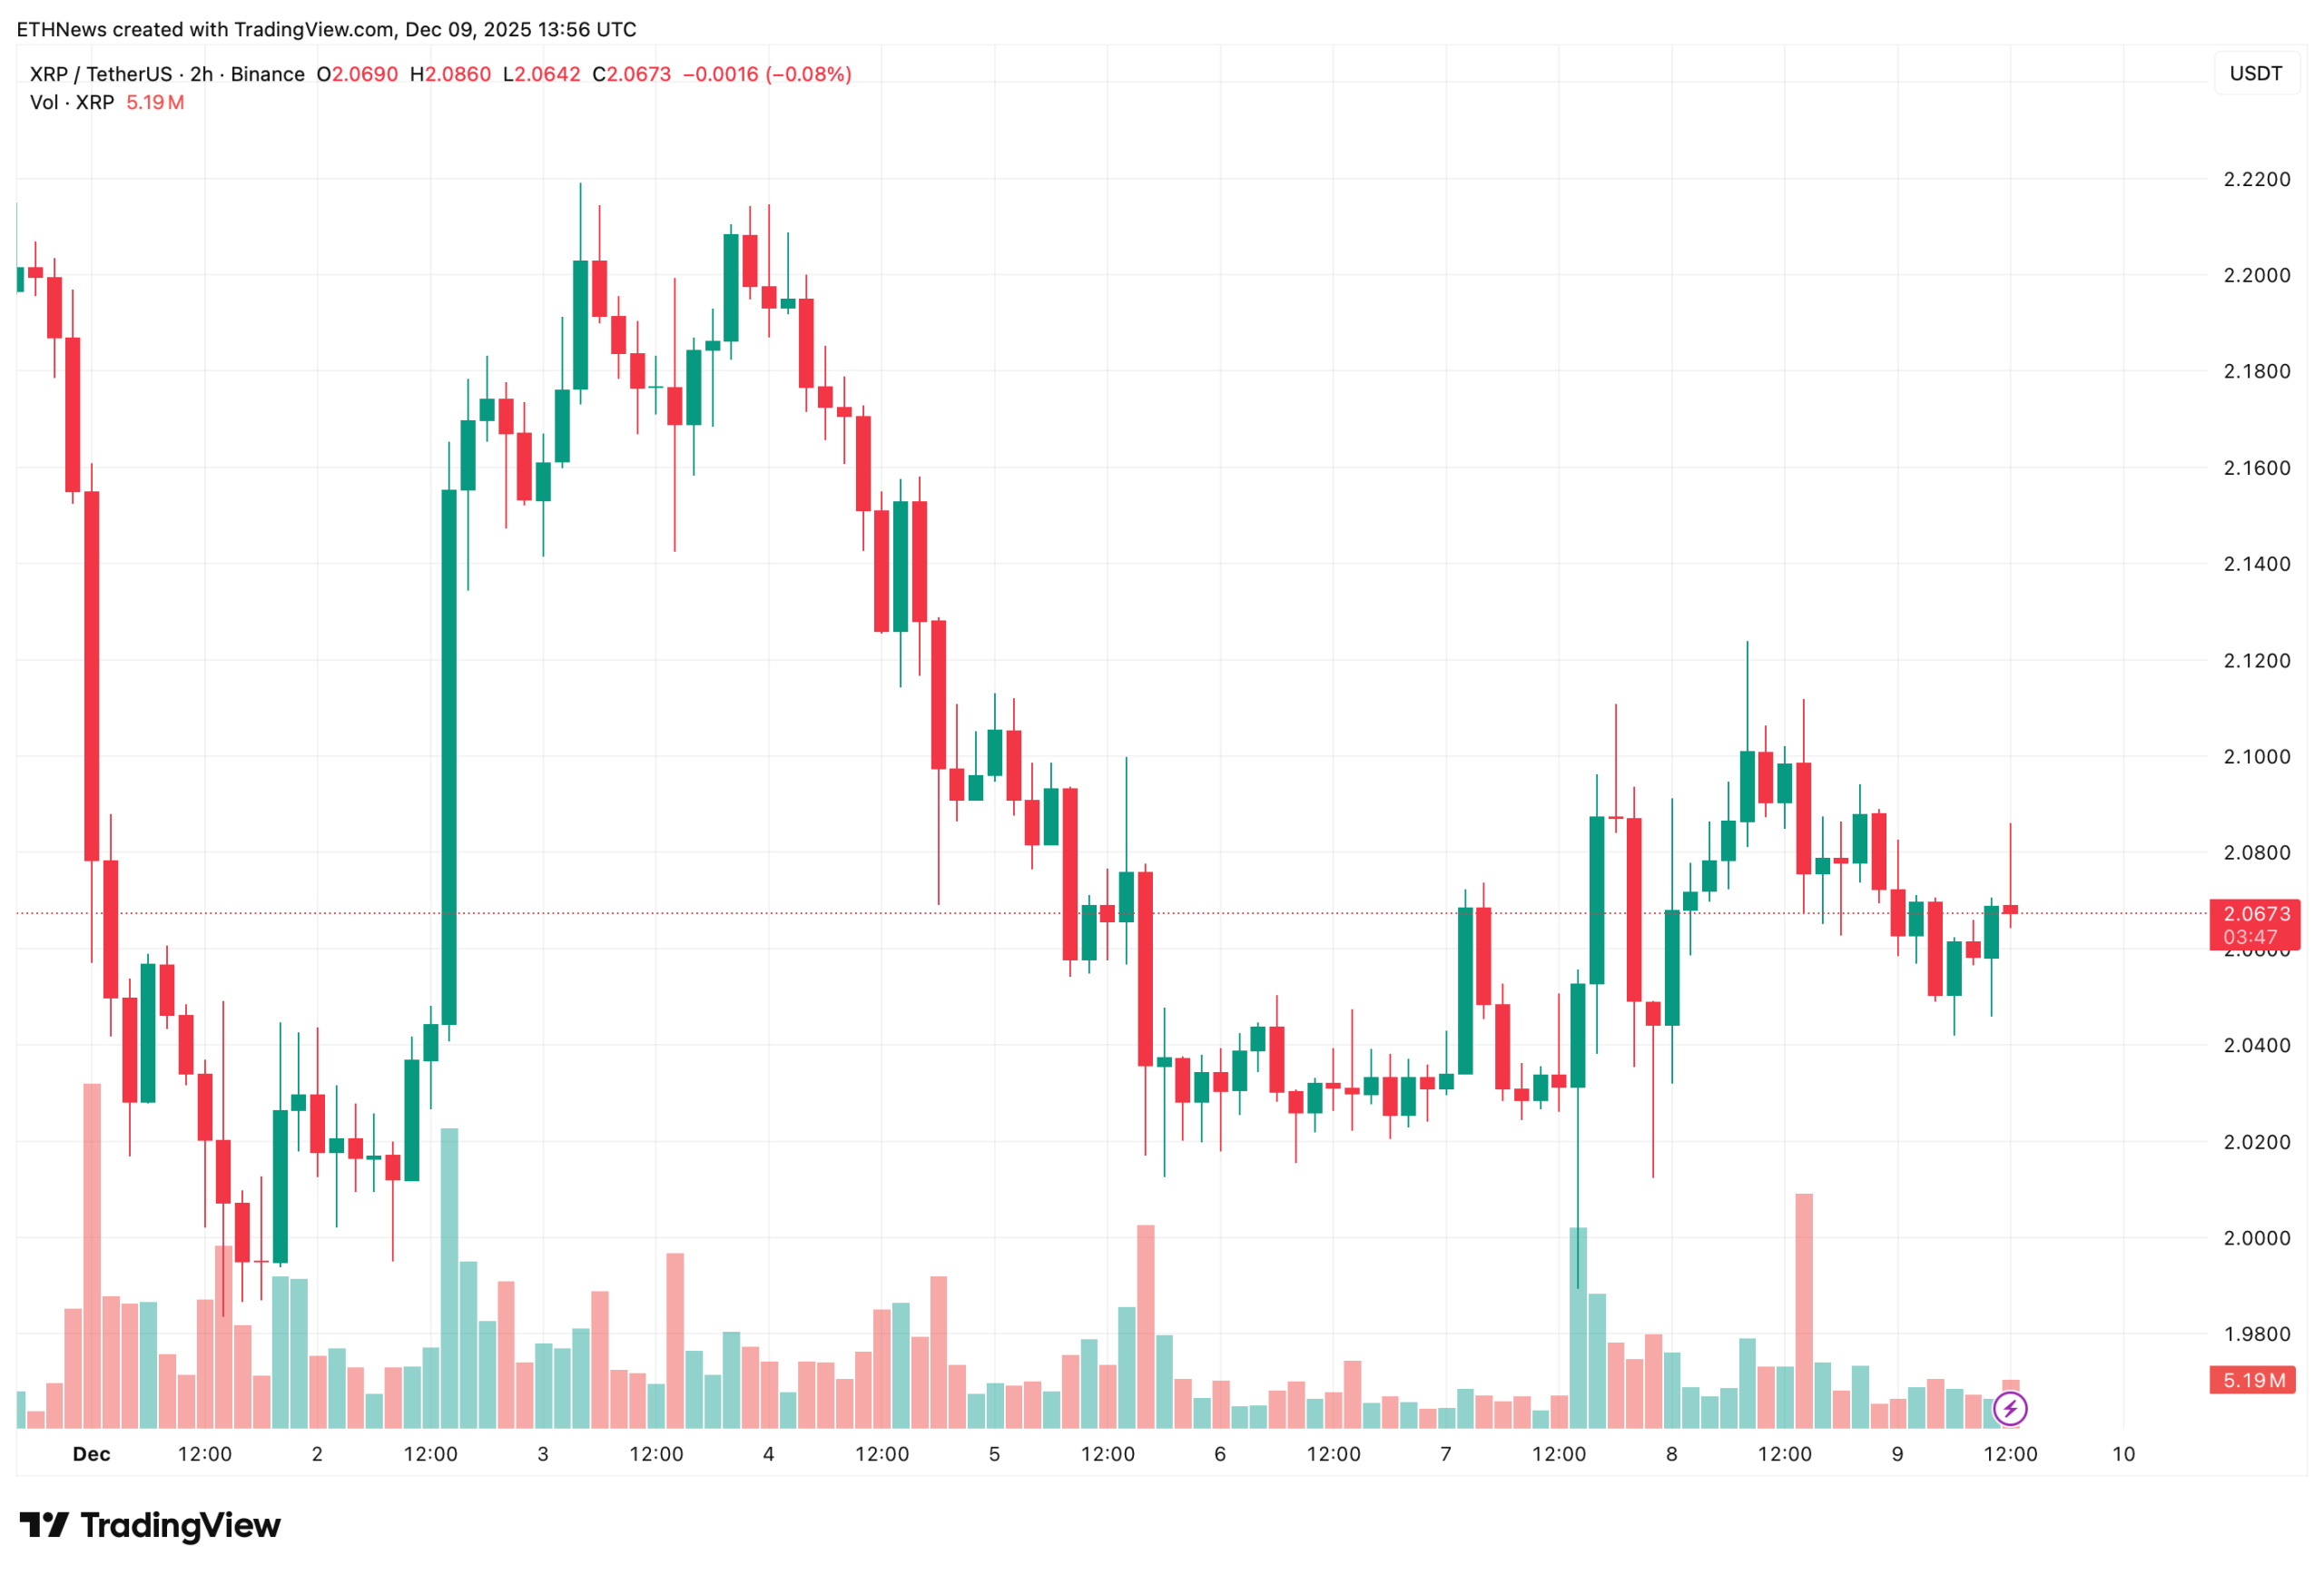
Price action over the past several sessions highlights three key features:
- Strong support between $2.00 and $2.04
This zone has repeatedly acted as XRP’s defensive line. Buyers continue to step in here, preventing a clean breakdown. The chart shows several long lower wicks in this region, signaling demand. - Local resistance around $2.10–$2.12
Each attempt to reclaim this area has been met with mild selling, marking it as the next hurdle. A clean break above $2.12 would shift short-term momentum upward. - Declining volume during consolidation
Volume has compressed notably, a condition often seen before large directional moves. The chart shows decreasing volume bars as XRP moves sideways, a sign of coiling energy rather than loss of interest.
If XRP breaks below the $2 zone with conviction, the structure weakens. If it holds, and especially if it clears $2.12, the technical picture supports EGRAG’s expectation of an expansion move.
Why Fractal-Based Technical Analysis Can Mislead Traders
Despite the bullish backdrop, EGRAG stressed that fractals are only approximations. He outlined several risks that traders frequently overlook:
- Cycles rhyme but never repeat exactly.
- Fractals strengthen bias and may hide invalidation signals.
- Liquidity drivers evolve each cycle.
- Macro catalysts can distort timing.
- Traders may anchor to targets instead of reacting to price structure.
His message is clear: fractals highlight possibilities, not certainties.
The Key Level That Keeps the Bullish Roadmap Alive
XRP’s broader roadmap remains intact as long as it defends the ~$2 weekly zone. The chart shows consistent absorption of selling pressure here, creating a foundation that can support a future breakout. Historically, when XRP compresses for extended periods, the next move tends to be sudden and forceful.
If history rhymes even partially, XRP may be approaching a critical transition window as the broader market heads into the mid-2025 to 2026 cycle.
For now, structure is stable, momentum is neutral but constructive, and price continues to hold where it needs to. The conditions for a repricing phase are not yet confirmed, but they are clearly forming.