
A new technical signal on XRP’s 3-day chart is catching the attention of traders, especially beginners who worry it marks the start of a bear market. The 50 EMA is moving toward the 200 EMA, a setup often associated with trend reversals. However, analyst EGRAG CRYPTO argues that this situation is being misunderstood and that the chart’s structure actually leans bullish, not bearish.
Why the Bear-Market Fear Doesn’t Match the Chart
EGRAG explains that a bearish EMA cross only has real meaning when price is already below both moving averages and momentum is decisively turning down. XRP is nowhere near that scenario. The price remains above the 200 EMA, and the 200 EMA itself is still rising instead of flattening or dropping. This does not resemble the early stages of a downturn. For beginners, this is an important reminder: EMAs matter most when combined with context, trend direction, and momentum.
Historical Patterns Show a Different Story
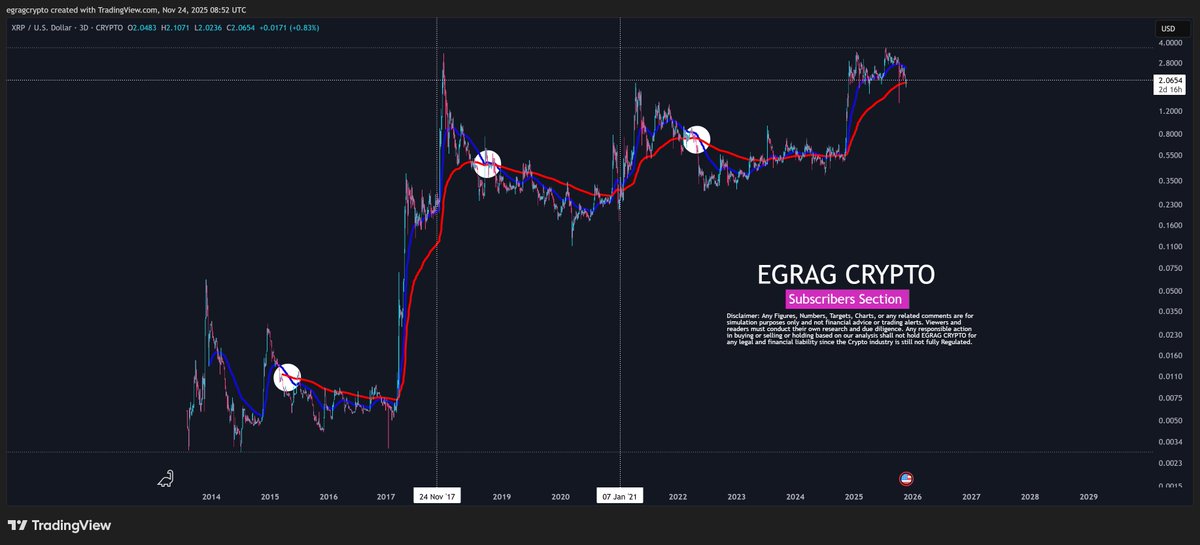
The current setup looks far more like the periods that preceded XRP’s strongest rallies. In both 2017 and early 2021, XRP showed tight EMA compression, price held above the long-term 200 EMA, and the market paused before exploding upward. Those structures mirror what the chart is showing today. In contrast, the 2018 EMA cross occurred only after the market had already crashed; it did not cause the bear market, it confirmed it.
What EGRAG’s Chart Highlights
The chart shows several historical phases where the moving averages squeezed together while price stayed supported above the 200 EMA. Each of these moments eventually led to major upside moves. The same behavior is appearing again now: rising long-term trend support, tight compression, and no signs of momentum failure. This suggests the market may be preparing for another expansion phase rather than a deeper breakdown.
Final Takeaway for Newer XRP Investors
EGRAG believes XRP is in a late-stage consolidation that often comes before a final upward leg in a cycle. Despite online chatter about bearish crosses, the broader structure does not support the idea of a macro downtrend beginning here. For beginners trying to understand the signal: this is not the classic setup for a prolonged bear market, and historically, similar patterns have led to XRP’s biggest rallies, not its biggest declines.