

Market Overview
XRP is experiencing a resurgence in market performance, reflecting a strengthening price momentum. This positive trend is supported by developments related to Exchange-Traded Funds (ETFs) and bullish technical indicators. Traders are closely monitoring the decline in Bitcoin dominance for further signals of XRP's potential for an extended rally.
Key indicators suggest:
- •XRP has risen, driven by institutional ETF listings that have boosted market sentiment. Daily price closes are showing a slightly bullish trend above support levels.
- •Technical charts indicate XRP's bullish potential, with key resistance identified near $3.65 and support around the $2.20–$2.30 range.
- •Traders are observing a decline in Bitcoin dominance and strength in the XRPBTC pair for potential signals of an extended breakout.
Institutional Developments Fuel Renewed Confidence
The recent price increase in XRP is coinciding with the launch of several XRP Exchange-Traded Funds (ETFs) on the Depository Trust and Clearing Corporation (DTCC). Listings from institutions such as Franklin Templeton, Bitwise, 21Shares, and CoinShares have significantly enhanced institutional support for the asset. This represents a major milestone toward mainstream adoption and signifies increased acceptance within conventional financial markets.
As of the current writing, XRP is trading at $2.53, according to CoinMarketCap data. This reflects a 11.31% growth in the past 24 hours, with a market capitalization of $152.3 billion. The trading volume has surged to $5.53 billion, indicating active market participation and greater liquidity. This influx of activity follows expectations that ETF launches later this month could provide broader exposure to XRP's market performance.
Market optimism has also been bolstered by an improved regulatory sentiment. A recent decision by the Senate to lift the government shutdown could expedite SEC processes and potentially lead to further ETF approvals. The combination of legal certainty and institutional support is contributing to the growing prominence of XRP within the digital assets industry.
Technical Outlook Points to Bullish Continuation
A detailed technical assessment shared by CryptoWZRD (@cryptoWZRD_) suggests that XRP's daily structure remains slightly bullish, indicating potential for further upside movement. The asset is currently rebounding from the $2.27 support zone, demonstrating renewed strength as Bitcoin dominance begins to decline.
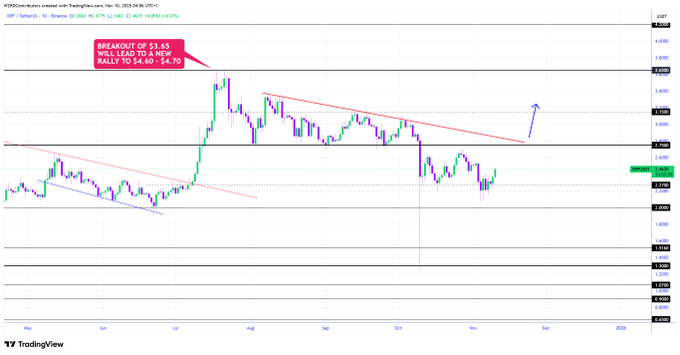
From a broader perspective, the key resistance level is situated near $3.65, which aligns with the upper trendline of XRP's current pattern. A decisive breakout above this level could pave the way toward the $4.60–$4.70 range, where previous liquidity clusters are located. Traders are closely monitoring the performance of XRPBTC, as sustained strength against Bitcoin could signal the commencement of a new bullish phase.
The presence of Dragonfly Doji candles on both XRP and XRPBTC charts suggests a potential reversal or continuation pattern. This indicates that positive buying momentum has been observed at lower price points, and investors are anticipating possible breakout trends should market factors continue to improve.
Market Sentiment and Trader Positioning
As of the current writing, XRP has advanced by +11.69% over the last 24 hours, with intraday gains of +2.58%. The asset holds a slightly higher position of +0.42 on a weekly basis, and its monthly gain of +7.67% reflects a consistent recovery trend. Despite these positive movements, XRP has experienced a loss of -18.98% over the past 90 days, indicating a period of slower growth following earlier market fluctuations.
Trader sentiment remains notably bullish across major exchanges. On Binance, the long/short ratio stands at 2.0855, with top traders exhibiting an even stronger long bias at 2.3456. The ratio on OKX, at 1.43, further reinforces this consistent optimism across platforms. However, elevated long exposure does warrant caution regarding potential volatility, particularly if rapid pullbacks occur.
Liquidation data indicates that recent rallies have led to the closing of short positions, amounting to $2.72 million in the last four hours. This trend is common when short sellers are forced to exit their positions during an uptrend, which can further accelerate price increases. The current market structure and volume data suggest a cautiously bullish trend, with resistance anticipated around $2.55-$2.60 and support levels near $2.35-$2.40, favoring short-term upward momentum.