
Consolidation Amidst Strong Trading Volume
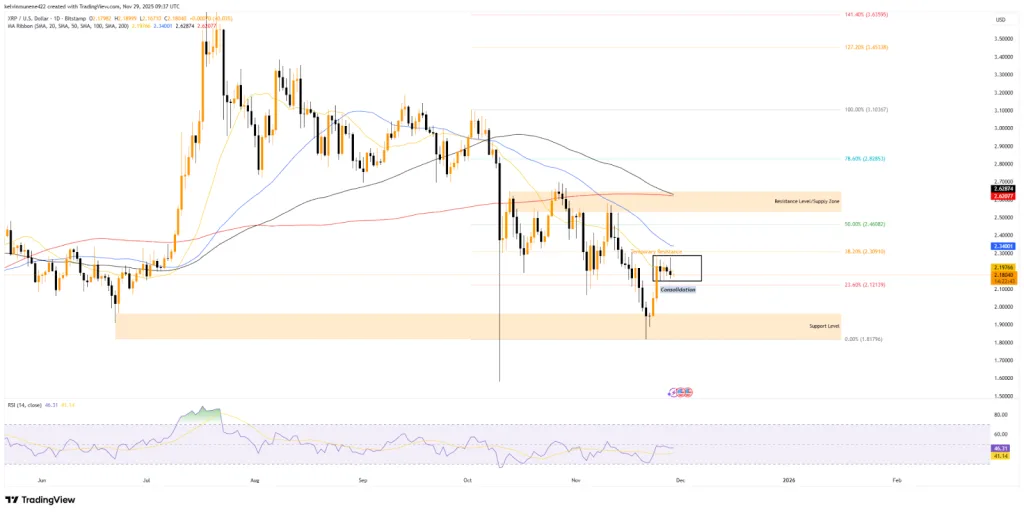
XRP has encountered significant resistance this week after approaching the $2.29–$2.30 area, a price point that has repeatedly halted its rallies in recent days. Consequently, the token has entered a narrow holding pattern as traders await clearer market signals. The current price structure, technical indicators, and on-chain data collectively suggest that while interest in XRP remains high, conviction among traders is low.
The upswing that began late last week propelled XRP more than 25% higher, pushing it back towards the established resistance around the 38.20% Fibonacci level at $2.30. This zone immediately stalled the upward momentum.
Since experiencing a rejection at this level, XRP has been trading within a confined range between $2.30 and $2.14. This band has remained consistent for several trading sessions without a decisive breakout. Despite the price consolidation, market activity is notably high.
XRP's 24-hour trading volume has surged by 30% to $3.73 billion, highlighting substantial participation in the asset. This unusual combination of high turnover and compressed price action indicates a stalemate, with neither buyers nor sellers gaining a decisive advantage.
Technical Indicators Signal Lack of Clear Direction
The Relative Strength Index (RSI) further supports this observation. Throughout the week, the RSI has remained close to the 50 midpoint, failing to close above it on any occasion. Currently at 46, the market is exhibiting a lack of strong directional bias.
This behavior is consistent with a consolidation phase, where neither buyers nor sellers have firm control. A move above 50 on the RSI would indicate a shift towards a neutral to bullish sentiment, while a decline below 40 could signal building downside pressure.
XRP's daily moving averages are also acting as near-term barriers. The 20-day moving average (MA), currently at $2.19, has repeatedly absorbed upward price attempts. Until prices decisively break and hold above this line, bullish efforts may prove to be short-lived. The 50-day MA, situated at $2.34, follows closely, forming a layered resistance cluster.
Open Interest Remains Stable, Indicating Trader Caution
Derivatives market data also reflects a period of inactivity. XRP's open interest is currently hovering around $4.13 billion, showing a marginal decline of 0.17% over the past 24 hours. More significantly, open interest has remained largely unchanged for an extended period, with traders avoiding large new positions for over a month.
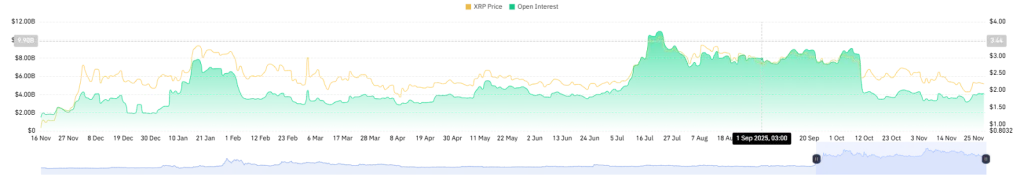
This static behavior is typically observed during periods of compressed volatility, where market participants prefer to wait for a clear directional breakout rather than attempting to predict the market's next move. Both price action and open interest are moving sideways, reinforcing the current market sentiment.
Key Levels to Watch for XRP's Next Directional Move
XRP's next significant price movement will depend on how the token interacts with its immediate technical levels. For a bullish continuation, traders will be closely watching three key developments:
- •A decisive break and sustained hold above the 20-day MA at $2.19.
- •A retest and successful clearance of the $2.30–$2.34 resistance zone, formed by the Fibonacci level and the 50-day MA.
- •A rise in the RSI above 50, confirming a renewed neutral-to-bullish strength in the market.
Successfully navigating these checkpoints could provide XRP with the necessary momentum to retest the 50% Fibonacci level at $2.46 and potentially challenge the supply zone located between $2.53 and $2.64.
Conversely, if XRP fails to reclaim these crucial levels, attention will shift to support. The 23.60% Fibonacci retracement level at $2.12 serves as the closest support holding the current range together. A breach of this support could open the path towards the broader $1.96–$1.81 area, which marked the starting point of the recent rebound.