

Key Insights
- •XRP is trading near the $2.04 triangle support, where a breakout or breakdown could trigger a major directional move.
- •ETF inflows continue for the 11th day, though momentum has decreased, showing reduced institutional urgency.
- •Derivatives show rising caution with more long liquidations and a growing short presence in retail positioning.
Price Action and Technical Indicators
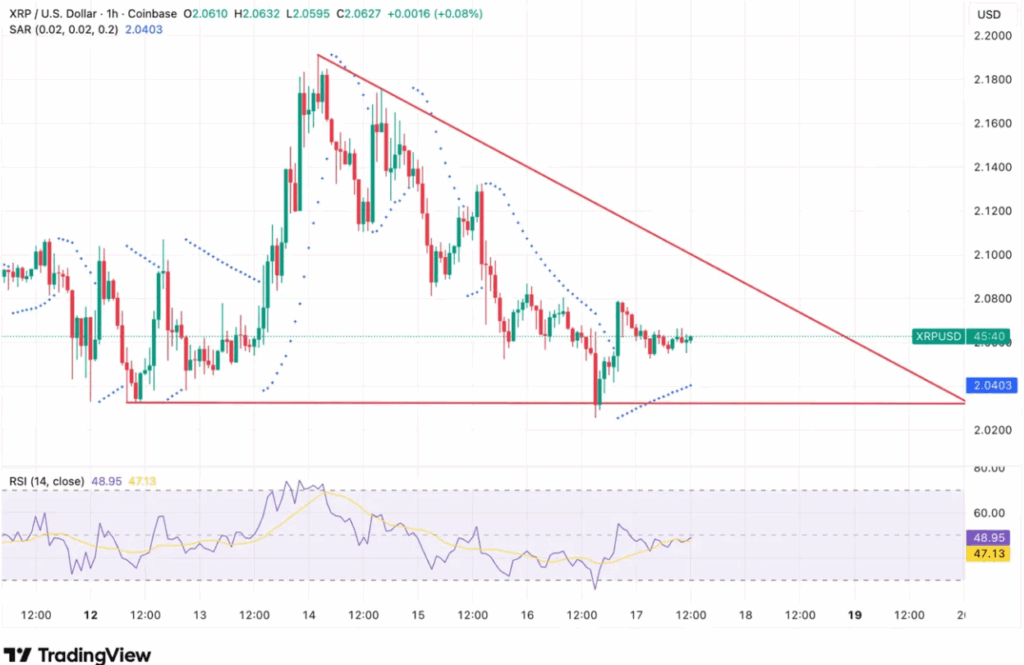
XRP continues to trade close to $2.06 as a descending triangle pattern develops on the hourly chart. Since January 14, a sequence of lower highs has formed from $2.19 to $2.08, while horizontal support at $2.04 remains intact. The pattern is now tightening, bringing the price to a critical decision point.
The Relative Strength Index remains neutral at 48.95, showing no clear bias. It has moved between 45 and 55 for three days. The Parabolic SAR has aligned with triangle support at $2.0403, reinforcing the importance of that level. A break above $2.10 could invalidate the bearish pattern, while a close below $2.04 may confirm downside momentum.
ETF Inflows Support Price but Momentum Slows
Despite consolidating prices, institutional demand continues, although at a slower pace. XRP spot ETFs logged $1.12 million in net inflows on January 16, marking 11 straight days of accumulation. Inflows on January 15 and 14 were significantly higher at $17.06 million and $10.63 million, respectively. Total ETF assets now stand at $1.52 billion, with cumulative net inflows reaching $1.28 billion.
Open interest increased slightly by 1.08% to $3.93 billion, but trading volume fell 27.43% to $3.09 billion. This suggests that while positions remain open, new trades are limited. The long/short ratio dropped to 0.92, pointing to increased short positioning. Over $5.82 million in long liquidations occurred in the past 24 hours, compared to just $320,000 in shorts. In contrast, top Binance traders exhibit a long/short ratio of 3.09, indicating a disparity between institutional and retail sentiment.
Daily Structure Meets EMA Resistance
On the daily chart, XRP hovers near the 20 and 50-day EMA cluster between $2.06 and $2.08, which has acted as a pivot level since December. Resistance at $2.20 and $2.32 continues to cap upward moves. The Supertrend indicator remains bullish at $1.9555, suggesting support remains valid unless the price falls below that level.