

XRP is exhibiting one of the most robust long-term bullish signals observed in years, leading analysts to suggest that the market may be on the cusp of a substantial upward movement.
A recent examination of the three-month Ichimoku Cloud reveals a configuration that even previous bull cycles failed to achieve, sparking renewed discussions among traders about potential higher price targets.
XRP Maintains Position Above Key Ichimoku Levels for the First Time
Market analyst Matt Hughes brought attention to this significant development. On the three-month chart, the XRP price has now sustained its position above the Ichimoku conversion line and baseline for nearly an entire year.
These two lines are fundamental trend indicators within the Ichimoku system. Consistently trading above both for an extended period is highly unusual and typically signifies strong trend momentum.
XRP briefly managed to re-establish these levels during the significant breakout in 2017 and the rapid rally in 2021, but it had not previously managed to build a stable base above them until now. It was only after the November 2024 breakout that this structure began to solidify, as the XRP price finally reclaimed the $3 level for the first time since 2017.
Although the price of XRP experienced a slight cooling after reaching $3.66 in July, it continued to hold above the conversion line and baseline throughout each pullback. Hughes commented that this level of stability "shows how powerful XRP’s bull trend actually is," particularly given the absence of any historical precedent for XRP exhibiting such strength on a multi-quarter chart.
Current XRP Chart Indicators
On the weekly chart, the XRP price is currently trading just below the $3 mark and is positioned beneath a critical resistance zone at $3.10.
This level has historically acted as a ceiling, and traders anticipate it will play a significant role once again. A break above this threshold is expected to open the chart to a series of higher targets that have been under discussion for months.
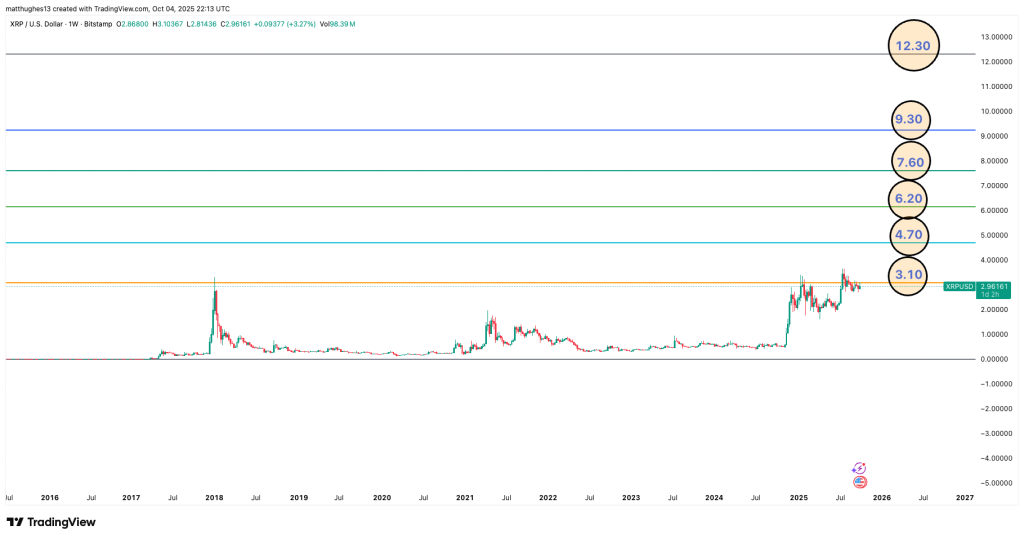
Hughes had previously identified these zones earlier in the year, illustrating a sequence of Fibonacci-based levels above the current trading range. In an earlier post, he also highlighted the 1.27 Fibonacci extension, approximately at $8.30, as a potential target if momentum accelerates similarly to previous cycles.
Other analysts are observing similar patterns. Trader Cryptollica posits that XRP is entering the final stage of a recurring four-phase pattern that was last observed between 2014 and 2018. If this pattern holds true, the expected upward movement could extend into the double-digit range, with $10 considered a realistic target based on historical behavior.
Factors Driving Potential XRP Price Increases
The technical analysis represents only one facet of the XRP outlook; fundamental developments surrounding XRP and Ripple have also been progressing positively.
The company has been actively establishing new partnerships and completing acquisitions, with each announcement contributing to increased confidence in the long-term prospects.
Additionally, the market is keenly awaiting the potential approval of U.S. spot XRP ETFs. Such an event could introduce a substantial new wave of demand, particularly from institutional investors.
With XRP now demonstrating its strongest multi-month structure to date, the next phase of its trend may be beginning to materialize. As long as the XRP price remains above the key Ichimoku lines, the possibility of a move into higher price ranges on the chart remains open.
Whether this leads to a return to the $4–$6 region or a push closer to $10, there is a consensus among traders: XRP has not displayed such strength in a considerable period.