

Bitcoin is currently retesting the $95,195 support level after forming a clear downtrend through multiple price levels. The cryptocurrency is trading within a descending trend channel, reflecting sustained selling pressure as the market approaches recent lows. The chart indicates repeated rejections from higher resistance zones and a consistent pattern of lower highs, suggesting the risk of further losses if buyers fail to defend the current support level.
Previously, BTC experienced rejections from the wide R2 resistance zone, which spans between $118,000 and $125,958. This zone aligns with the 1.414 Fibonacci extension at $125,958.47, and its rejection led to a sharp price decline. Subsequently, Bitcoin moved back into the R1 region below $116,262, where increased selling pressure initiated the current downward trend.
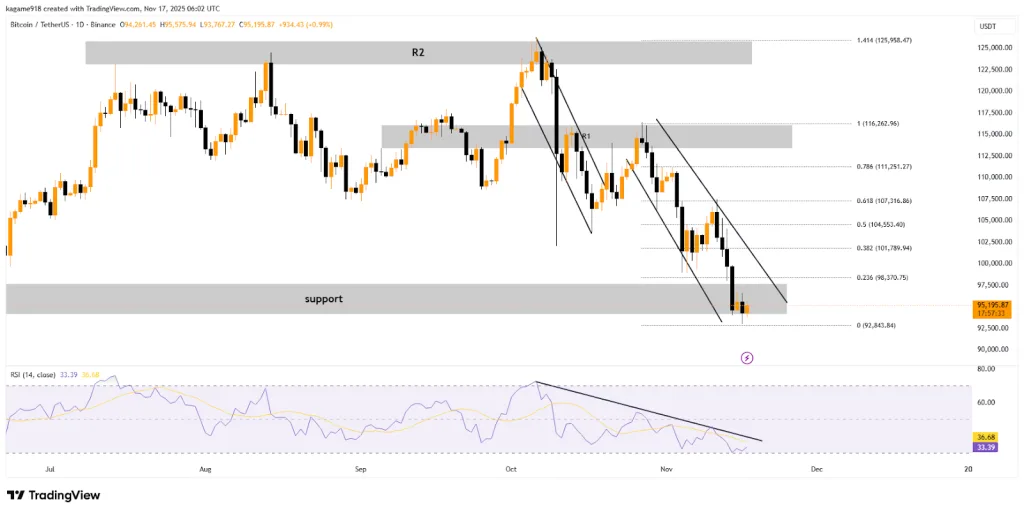
The market is currently trading below the 0.236 Fibonacci level at $98,370.75, a level that has rejected multiple attempts to close above it. Bitcoin's price is interacting directly with the broad support band around $95,000, which is acting as a technical pivot. Should this level fail, BTC is likely to approach the 0.0 Fibonacci target at $92,843.84, based on the current chart structure.
The Relative Strength Index (RSI) is currently at 33.39, continuing a declining path from its October peak of approximately 78. This trend indicates diminishing strength across the chart and reflects the prevailing lower-high price movement pattern.
For Bitcoin to initiate a recovery, it needs to break above the upper trendline of the descending channel, which is currently located near $100,000. Following such a move, key resistance levels to watch would be $101,789, $104,553, and $107,316, which represent progressive Fibonacci levels that typically act as structured barriers.
Market Liquidations Rise Sharply as Traders Face Heavy Losses
The cryptocurrency market experienced significant volatility over the past 24 hours, with total liquidations reaching $619.75 million across various tokens. Bitcoin (BTC) and Ethereum (ETH) were the primary contributors to this total, accounting for $243.53 million and $169.99 million in liquidations, respectively. Other assets like Solana (SOL) saw $21.70 million in liquidations, while Zcash (ZEC) recorded $31.98 million, and miscellaneous assets contributed $36.20 million.
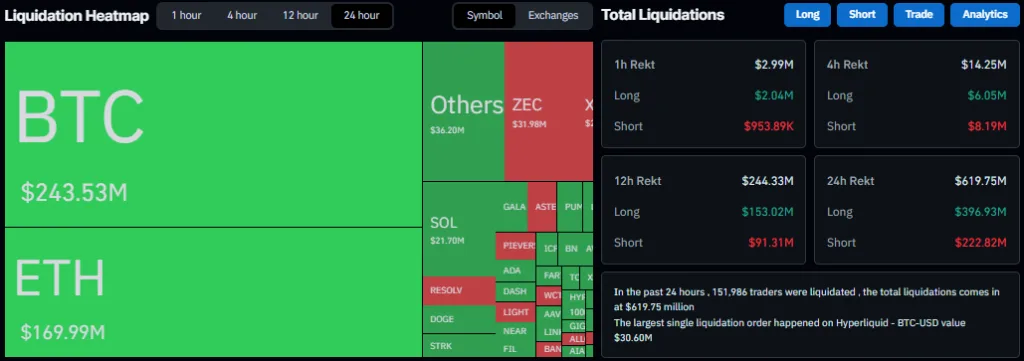
Liquidation activity remained elevated across shorter time frames as well. In the last hour, liquidations totaled $2.99 million, with $2.04 million stemming from long positions and $953.89k from short positions. Over the past four hours, liquidations reached $14.25 million, driven by $6.05 million in long liquidations and $8.19 million in short liquidations. The twelve-hour period saw liquidations amount to $244.33 million, comprising $153.02 million from long positions and $91.31 million from short positions.
A total of 151,986 traders were liquidated within the 24-hour period. The largest single liquidation recorded was $30.60 million on the Hyperliquid BTC-USD pair, representing the most substantial individual loss within this timeframe. These figures collectively highlight the increased market stress observed during the recent price decline.
Stablecoin Reserves Show Strongest 30-Day Surge Since 2024
According to data from CryptoQuant, exchanges have recorded a significant increase in ERC-20 stablecoin reserves, with a rise of over $7.3 billion over the last 30 days. This marks the strongest surge in stablecoin reserves since the Bitcoin rally in November 2024. The influx of stablecoins has been observed across major platforms including Binance, Bybit, and OKX, breaking away from the previous oscillating pattern in reserves and showing a sharp upward trend.
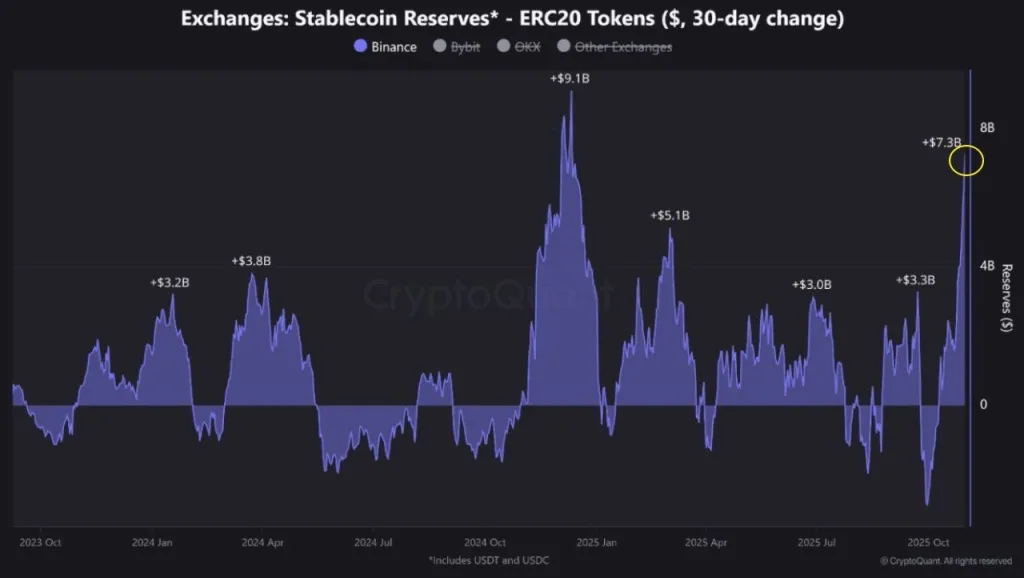
Previous notable peaks in stablecoin reserves include a $3.2 billion increase in early 2024, $3.8 billion in April 2024, $9.1 billion in late 2024, $5.1 billion in early 2025, $3.0 billion in mid-2025, and $3.3 billion in late 2025. These historical data points reveal a pattern of periodic expansions in stablecoin reserves that have often preceded significant market movements. The most substantial prior rise occurred in late 2024, when a $9.1 billion jump in reserves was shortly followed by a multi-week Bitcoin breakout.
The current surge of $7.3 billion represents a notable deviation from the extended oscillating pattern observed in stablecoin reserves between October 2023 and October 2025, where reserves frequently fluctuated above and below the zero line. Historically, substantial increases in reserves of this magnitude often indicate that exchanges are preparing for heightened trading activity, based on past market indicators.