

Technical Breakout Signals Shift in Market Sentiment
The price of Starknet (STRK) has recently captured significant attention with a sharp, seemingly sudden upward movement. However, a closer examination reveals that this breakout was not without precedent, stemming from underlying technical patterns and market activity. The token STRK has rallied more than 20% in the past 24 hours and over 80% in the last three weeks, indicating a substantial shift.
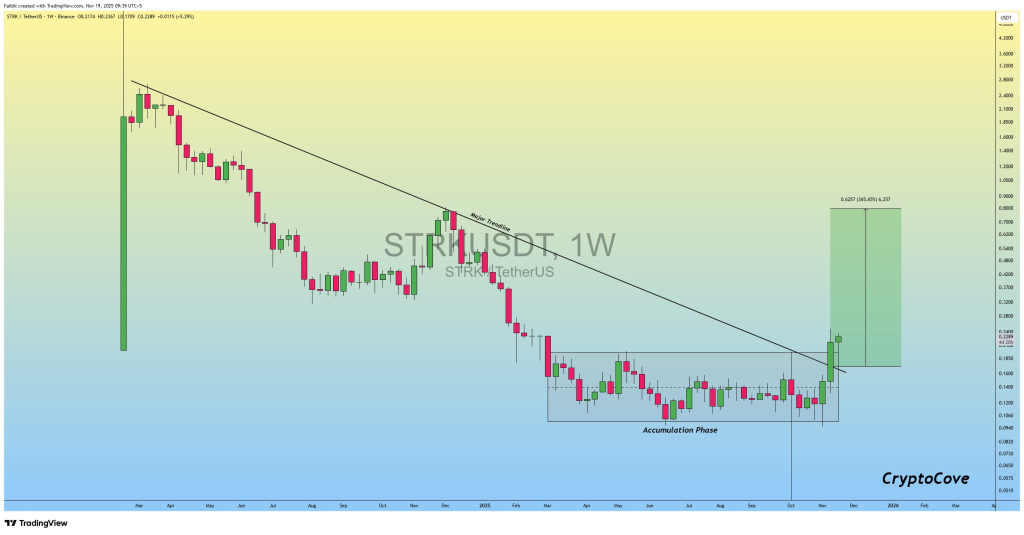
Analysis of the weekly chart shows a prolonged downtrend that has finally found a stable base. For weeks, the price consolidated within a tight accumulation zone, a period where buyers and sellers reached a balance. The recent weekly candle closed decisively above a long-standing falling trendline, marking a significant technical breakout. Following this breakout, the price retraced to test the former resistance area, which subsequently held firm as support, a common indicator of strengthening bullish sentiment. Trader Captain Faibik highlighted this pattern, identifying the breakout and subsequent retest as the primary catalyst for the current price surge.
Chart Patterns Suggest Further Upside Potential
The concept of "measured moves," often derived from the height of accumulation boxes and pre-breakout structures, suggests potential future price targets. The green target area indicated on accompanying charts points to a possible extension if current momentum persists. The breakout, followed by a successful retest, has established a clear higher low, a classic bullish structure that, if maintained, typically signals further upward movement.
The significance of the weekly timeframe confirmation cannot be overstated, as such signals generally carry more weight than intraday fluctuations. Many market observers consider a successful retest of a trendline as a strong endorsement from buyers, indicating their readiness to defend the newly established support level.
Captain Faibik further emphasized the critical nature of the resistance-to-support flip. He also noted that the price advance was not a singular, explosive move but rather a controlled progression involving a pullback to test the trendline before continuing upward. This measured approach often suggests a healthier, more sustainable rally compared to abrupt, speculative pumps. His commentary suggests that STRK has "left the station," implying that momentum has begun and is likely to continue if the established structure remains intact.
On-Chain Data and Orderbook Dynamics Bolster Bullish Outlook
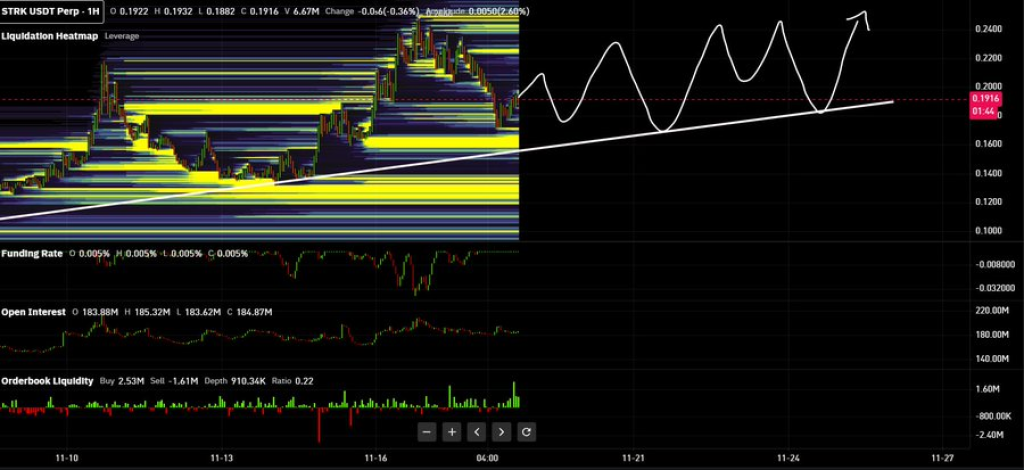
Adding another layer to the bullish case, analyst BTCL2Sync provided an in-depth look at accumulation activity. Their analysis identified a concentration of buy orders within the $0.18 to $0.19 range, suggesting a robust support zone where larger buyers have actively entered the market. This area has acted as a protective barrier, and the overall structure has also shown a rising trendline with a consistent series of higher lows.
Funding rates for STRK have remained near neutral but have shown a slight bias towards buyers. Open interest has hovered around $183 million, indicating significant market participation. Furthermore, the orderbook analysis suggests a tilt towards buy-side demand. While these indicators do not guarantee further price appreciation, they provide a compelling explanation for STRK's divergent performance compared to many other altcoins in recent times.
The past three weeks have presented a mixed performance across the broader cryptocurrency market, with many altcoins struggling to break out of consolidation patterns. In contrast, STRK has demonstrated steady advancement. This resilience is attributed to the confluence of its strong technical structure, increased accumulation by significant market participants, and clear weekly confirmation signals, resulting in a sustained uptrend rather than a fleeting spike.
Short-Term Outlook for Starknet (STRK)
The critical level to monitor in the short term is the flipped support zone, roughly between $0.185 and $0.190. Maintaining price levels above this area is crucial for continued upward momentum. A decisive push above near-term resistance could pave the way towards the target zone identified on the weekly chart. Analysts have suggested potential moves towards $0.22 to $0.24 if current momentum is sustained. Conversely, a breach of the established trendline and a drop below $0.18 could lead to a retracement towards earlier support levels. The technical structure remains the primary guide for navigating these potential price movements.
In the dynamic landscape of cryptocurrency, short-term narratives can evolve rapidly. The combination of the weekly breakout, the clean retest of support, and the clear accumulation zone provides a robust explanation for Starknet's recent outperformance. Captain Faibik's visual chart analysis clearly illustrates this market shift, while BTCL2Sync's deeper dive into order flow dynamics further substantiates the move.
A compelling setup is currently in play. The market structure will either hold, facilitating further continuation, or it may pull back, necessitating a deeper consolidation phase. Observing STRK's behavior around the $0.185 to $0.190 support zone will be key to understanding the next phase of its price action.