

ONDO price has returned to a critical juncture after enduring months of significant downside pressure. Current chart analysis indicates ONDO is trading near levels that historically signify a transition from exhaustion to opportunity. Following an extensive correction of approximately 85% from its all-time high, ONDO's price action is currently consolidating within a zone where structural support, liquidity, and long-term demand converge.
This setup becomes more apparent when viewed from a broader perspective. From a macroeconomic standpoint, the recent decline has effectively purged late-stage momentum while preserving a long-term structure that continues to attract considerable attention.
Analyst Crypto Patel highlights that ONDO price is currently situated within a high time frame demand zone, specifically between the $0.30 and $0.20 price levels. This zone is significant as it represents the same area where bullish order flow previously emerged, preceding the last major price expansion. The chart illustrates that former support around the $0.73 to $0.80 range has failed and subsequently acted as resistance, confirming a classic breakdown and retest structure rather than indicating random market weakness.
ONDO Price Structure Shows Compression After A Full Cycle Reset
ONDO price reached its peak near $2.14, at which point bearish divergence became evident on the weekly timeframe. This divergence signaled a macro top, rather than a mere temporary pause in its upward trend. The subsequent decline brought the price back into a long-standing accumulation region that had not been revisited since the early stages of its expansion phases.
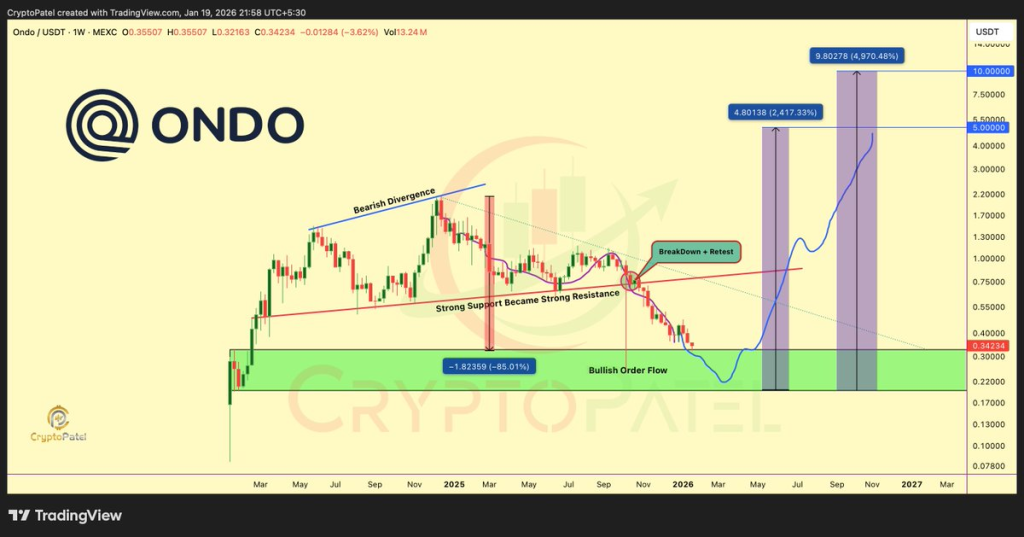
Crypto Patel further points out that the price is now consolidating above the $0.20 mark, a level that holds significant structural importance on higher time frames. Weekly closes above this zone are crucial for maintaining the broader structure, while any sustained acceptance below it would challenge the prevailing bullish thesis.
The chart also suggests the possibility of a final retracement into the bullish order flow zone, which spans from $0.32 to $0.20. This area aligns with historical demand levels and the origins of previous impulse moves, which explains its continued draw on market attention.
ONDO Price Finds Support From On-Chain Demand Signals
Beyond its technical structure, ONDO price behavior is also supported by notable on-chain trends. Crypto Patel references an increase in the 90-day cumulative volume delta, which suggests that sustained buy-side pressure is currently outweighing sell pressure. Whale spot orders appear to be concentrated in the $0.35 to $0.40 range, indicating interest during periods of weak price action rather than during euphoric highs.
This pattern often reflects accumulation activity rather than distribution. Furthermore, taker buy dominance provides additional support for the idea that stronger hands are gradually positioning themselves in the market, as opposed to chasing momentum.
ONDO Price Outlook Tied To Unlock Absorption and RWA Narrative
A significant variable that is expected to shape ONDO price expectations involves the token unlock scheduled for January 18, 2026, which will release approximately 1.94 billion ONDO. Crypto Patel emphasizes that the market's behavior surrounding this supply event will be more critical than the headline number itself. Full absorption of these tokens would signal strong underlying demand, rather than weakness driven by dilution.
Potential price targets outlined on the chart extend towards $0.70, $1, and $2. If the broader market demand holds and real-world asset narratives regain momentum into 2026, further targets could reach the $5 to $10 range.
ONDO price is currently at a crossroads where patience is often more valuable than reacting to short-term market noise. The upcoming months are likely to reveal whether this current zone will serve as a foundation for future expansion or represent a final test of investor conviction before the next market cycle takes shape.