

Kaspa's price has surged, offering a welcome relief to its community after months of declining value. The KAS token has experienced an impressive rally of over 40% this week, now trading around the $0.06 mark. This performance positions it as one of the top performers in the current market. For a project that has faced considerable challenges since the November market downturns, this upward movement represents one of its most significant rallies of the year.
Technical Analysis Suggests a Bullish Breakout
Analyst Crypto Bull God suggests that this recent price action might signify more than just a temporary rebound. In a recent analysis, the expert pointed out that KAS is on the verge of breaking out of a falling wedge pattern against Bitcoin. This technical setup, according to the analyst, carries substantial potential for further upside gains.
Kaspa Chart Analysis
The chart under review is a two-week KAS/BTC chart, designed to provide a broader perspective by smoothing out short-term fluctuations. For a significant portion of 2024 and 2025, the KAS/BTC pair has been confined within a descending channel, also known as a falling wedge. This pattern is characterized by a series of lower highs and lower lows, accurately reflecting Kaspa's underperformance relative to Bitcoin over the past year.
This wedge is defined by two primary trendlines. The upper trendline, depicted in black, serves as dynamic resistance, connecting a consistent sequence of lower peaks. The lower black trendline connects the series of lower troughs and has historically acted as a support level during major sell-offs. Within this structure, the price has steadily declined while Bitcoin has dominated market attention.
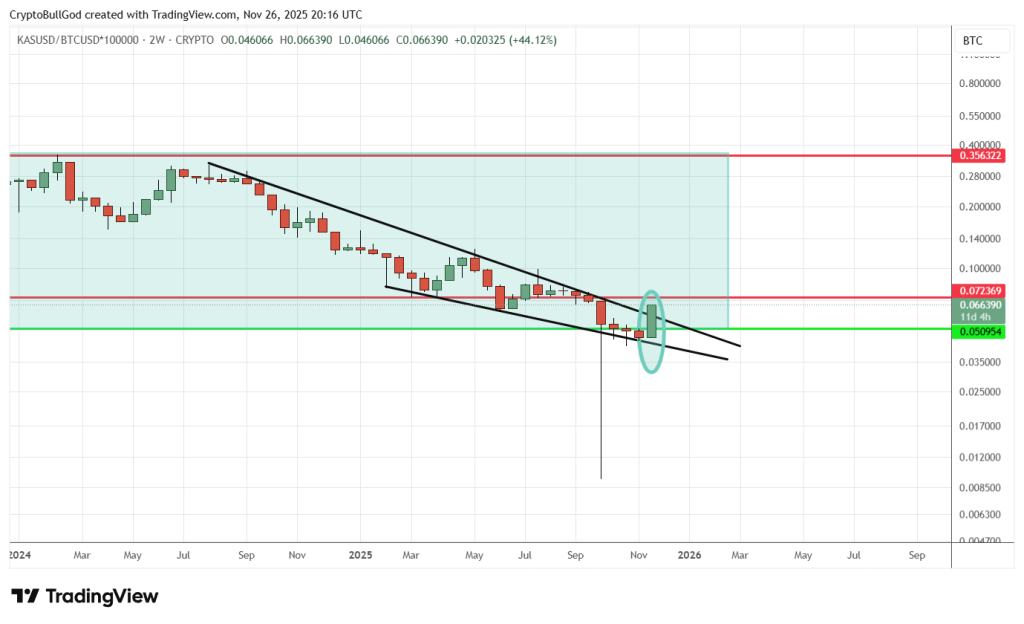
At the lower boundary of this range lies a robust horizontal support zone, indicated by a green line, approximately at 0.050954 on the KAS/BTC scale. The recent price surge appears to have originated from this level. The cluster of candles within the highlighted oval demonstrates a sharp bounce in Kaspa's price from this support, pushing it back towards the upper trendline of the wedge.
The most recent two-week candle is particularly noteworthy. It exhibits a strong upward body and is currently testing, and in some instances, breaking through the upper trendline. This behavior is a key indicator that traders often look for when anticipating a falling wedge breakout. If the current candle closes above this trendline and the subsequent candle confirms the breakout by holding its position, the market structure could shift from a pattern of persistent lower highs to one indicating a potential trend reversal.
The analyst also identifies a horizontal resistance level above, situated around 0.072369. This represents the next significant price target for the KAS/BTC pair. A decisive move above this zone would not only confirm Kaspa's exit from the wedge but also signal the commencement of a new phase of outperformance against Bitcoin. Beyond this level, the chart suggests ample room for price appreciation towards the upper region of the broader range, where prior peaks were significantly higher.
Assessing the Likelihood of the Bullish Scenario
From a technical analysis perspective, a falling wedge pattern that breaks to the upside is a well-recognized bullish reversal signal. These patterns typically form when selling pressure gradually diminishes, leading to a compression of price. Eventually, the market structure breaks, trapping late short sellers as buyers re-enter the market.
Kaspa's recent price action aligns well with this narrative. The price had been in a downtrend for months, market sentiment was notably negative, and many investors had expressed a loss of confidence. The sudden surge in KAS price, occurring while much of the broader market remained cautious, highlights a potential shift. This combination of washed-out sentiment and strong relative price movement can be a potent catalyst for significant gains.
However, certain risks remain. Given that this analysis is based on a higher timeframe chart, a single instance of breaking through resistance may not be sufficient for a sustained trend reversal. If KAS fails to maintain its position above the wedge and subsequently falls back within its boundaries, the pattern could be invalidated as a "fakeout," potentially leading to a retest of the green support area. Furthermore, Bitcoin's own price volatility plays a crucial role; any sharp downturn in BTC could temporarily hinder Kaspa's ability to outperform in the short term.
Despite these considerations, the current outlook for Kaspa appears more positive than it has in a considerable period. The project has successfully defended a critical support level, demonstrated a strong rebound, and is actively challenging a trendline that has capped its price for over a year. If Crypto Bull God's projection proves accurate and the breakout is sustained, the current week's 40% rally could indeed mark the beginning of an extended period where Kaspa transitions from simply maintaining its position to leading market performance.