

Ethereum is showing signs of stabilization after two intense weeks of corrective selling, with price action indicating a potential bottoming structure. The cryptocurrency is currently defending a major support band between $2,850 and $3,350, a zone identified by market analysts as crucial for maintaining bullish momentum.
The Key Support Zone Is Holding
Market analysis indicates that the current price action is respecting a critical support structure. This zone has historically served as a defensive line for bullish sentiment, acting as both support and resistance during significant market pivots. In the recent decline, Ethereum experienced a sharp drop into this area but has so far avoided invalidating the higher-timeframe structure. As long as ETH remains above the highlighted local lows, the bullish thesis is considered to be intact.
A weekly close above $2,850 would significantly increase the probability that the market has overcome the worst of the recent correction, at least in the short term.
Chart Breakdown: Key Structural Elements
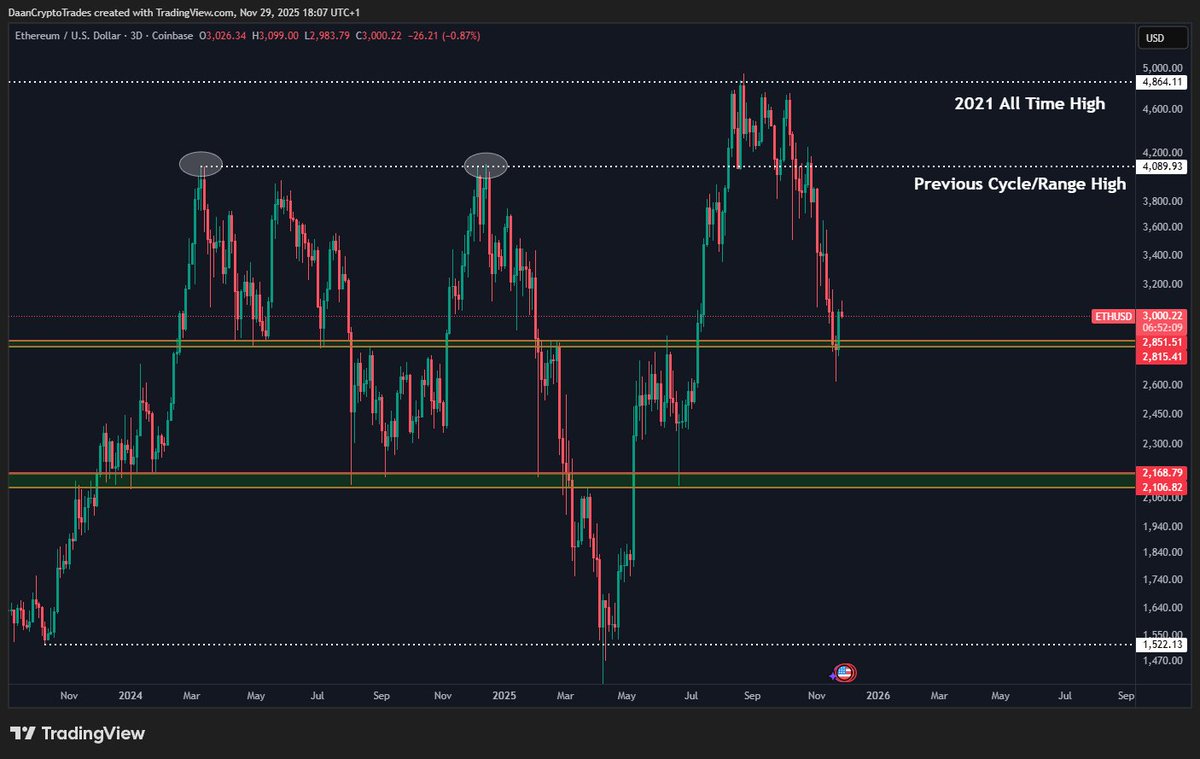
An examination of the high-timeframe chart reveals three significant elements influencing Ethereum's current position:
Long-Term Horizontal Levels
- •$2,850 – This represents the lower boundary of the critical support zone, historically defended by buyers.
- •$3,350 – This marks the upper boundary of the current consolidation zone.
These ranges are considered essential for bullish continuation.
Previous Cycle Range High
Ethereum is currently positioned just above the range high from the previous market cycle. This area is often a point where significant retracements stabilize before the initiation of new upward trends.
2021 All-Time High Interaction
While Ethereum remains below its 2021 all-time high, the recent correction has not broken the macro structure that was established after reclaiming this long-term range earlier in the year.
Short-Term Price Action Shows Gradual Recovery
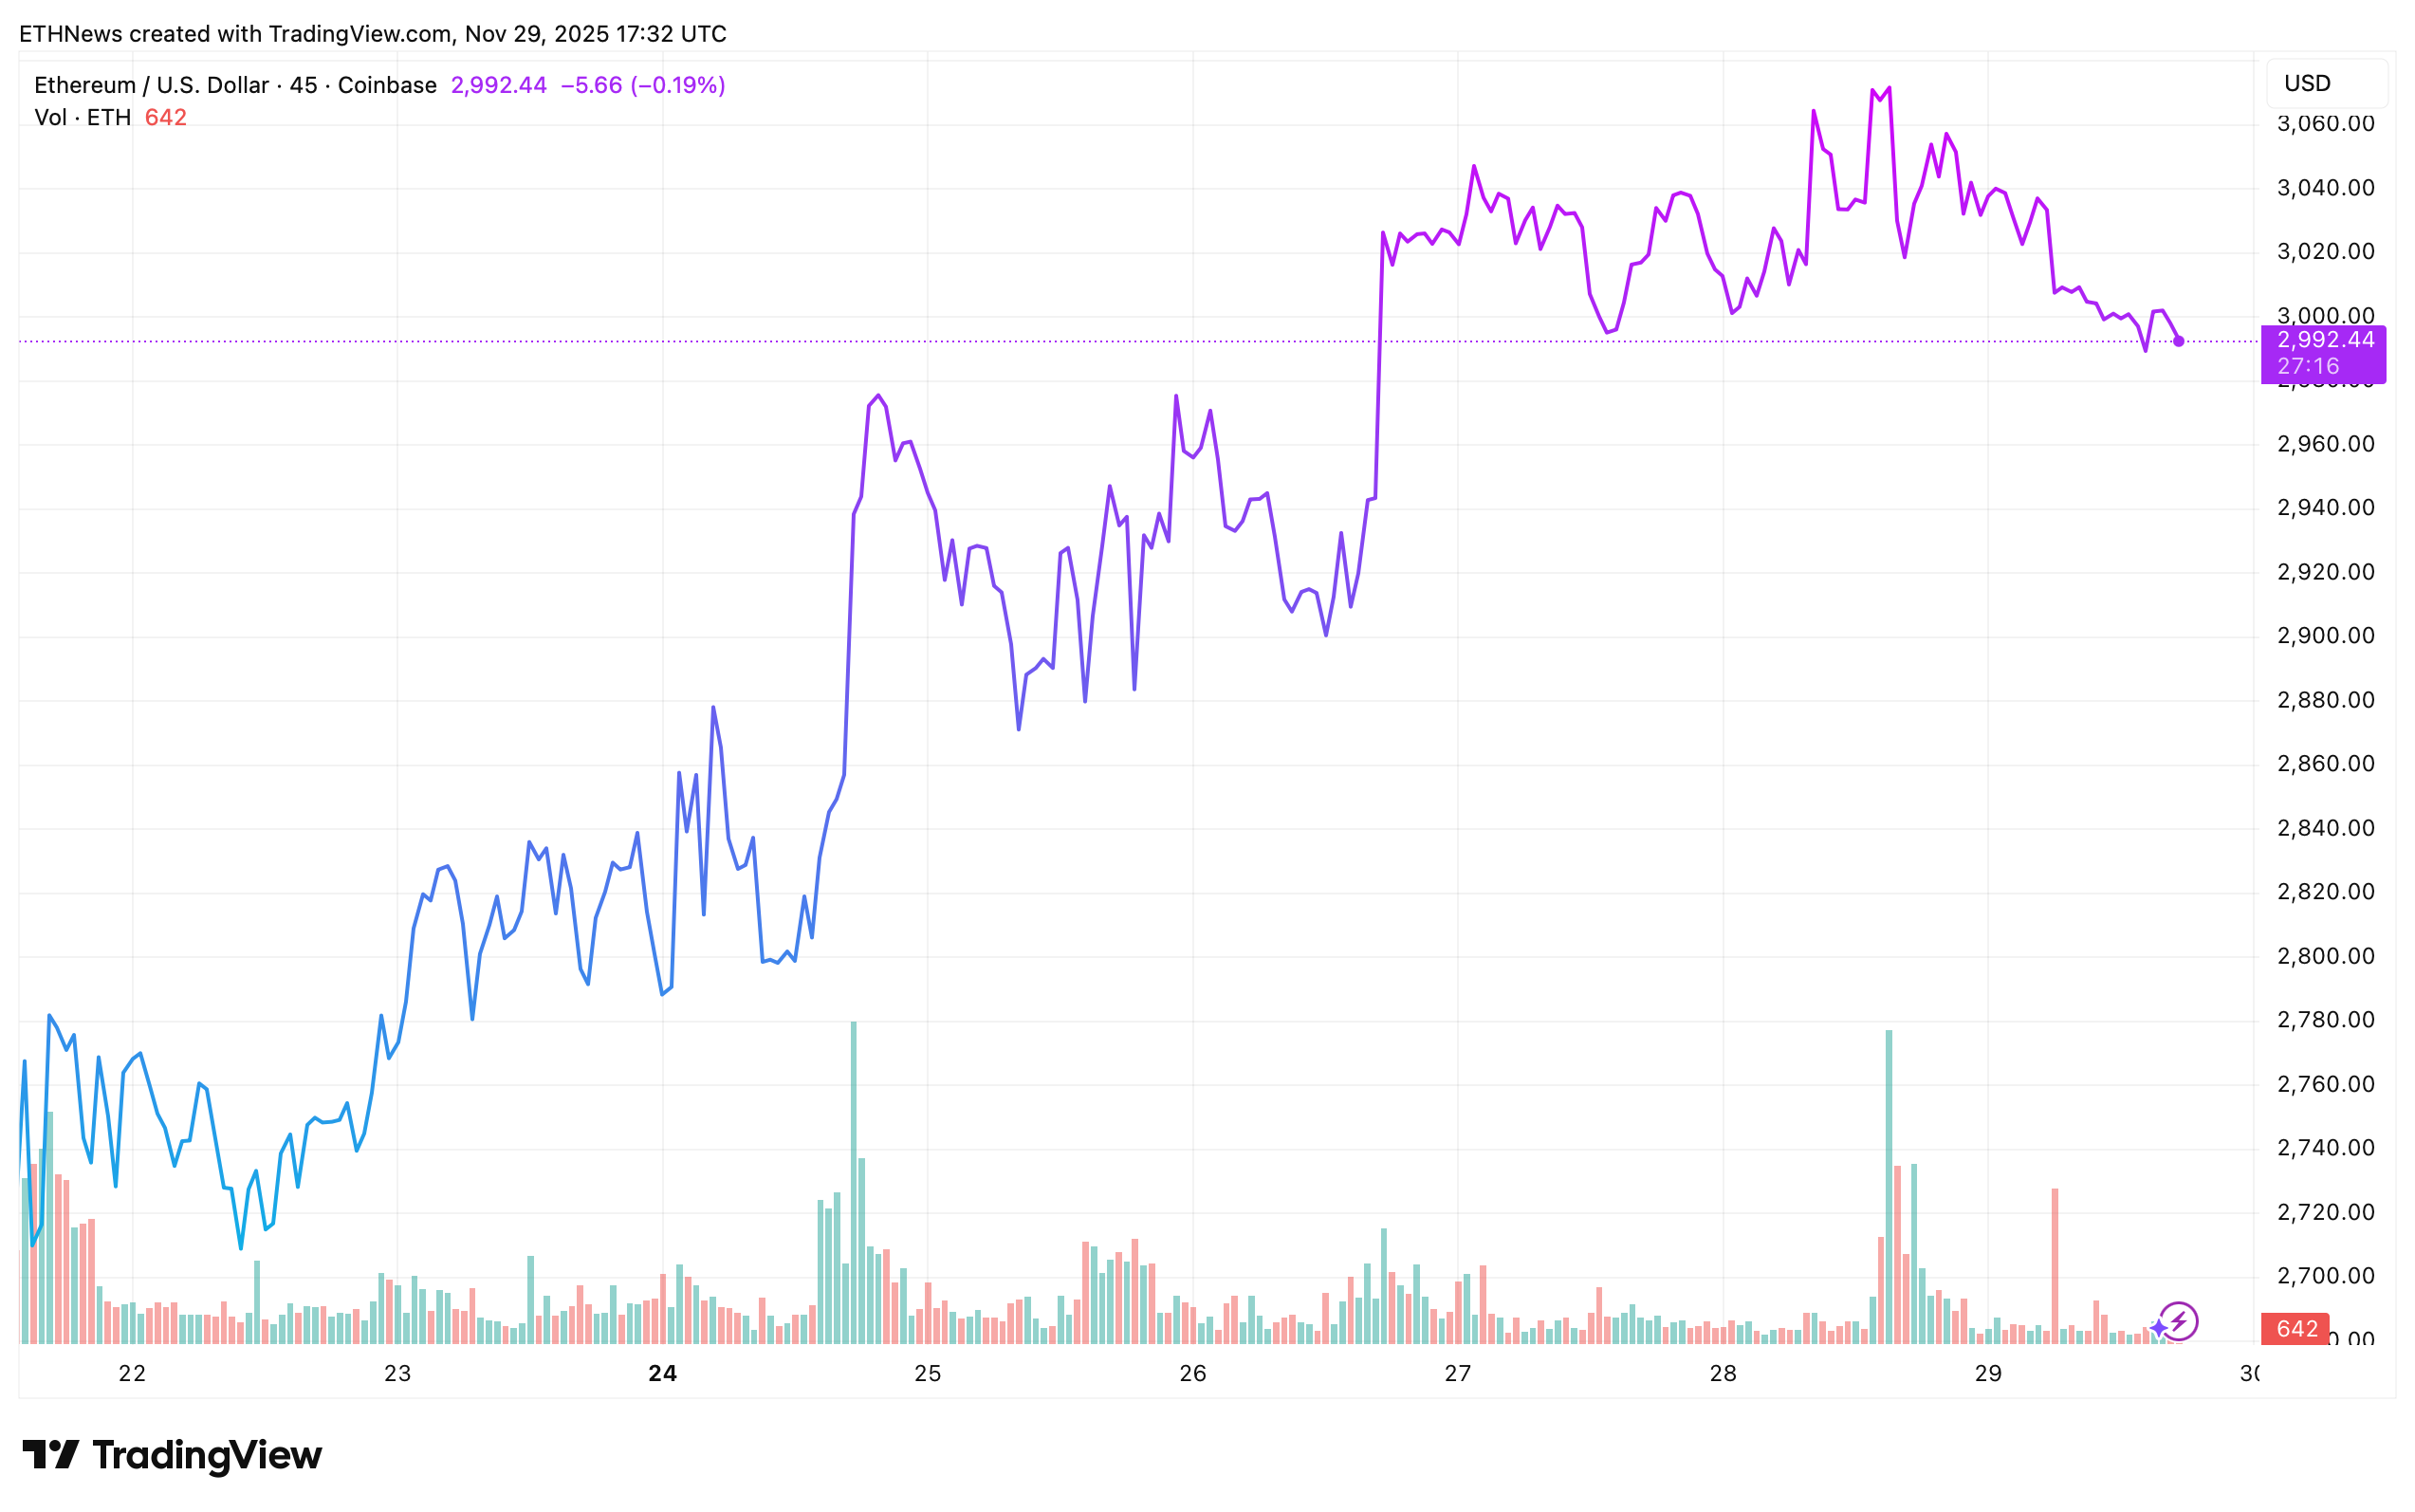
On the short-term chart, Ethereum is trading within the $2,990–$3,020 range. The price has experienced multiple intraday swings with declining volatility, suggesting a gradual recovery. Although the market remains somewhat choppy, the price action is forming a rounded stabilization pattern, indicating a potential loss of momentum for sellers following the aggressive move earlier in the week. Trading volume has softened, and the market appears to be transitioning from panic selling towards accumulation, a behavior often observed after sharp price corrections.
Future Outlook and Key Indicators
Market participants will be closely monitoring two primary factors:
Weekly Close Above Support
A strong weekly candle closing above the $2,850 support level would serve as confirmation of structural strength and provide bulls with room to attempt a recovery phase.
First Resistance Zone Ahead
Analysts have identified the 20-Day Moving Average as the first significant resistance zone. This level currently aligns with a horizontal sell zone. It is anticipated that many short-term traders may take profits in this area, potentially requiring Ethereum to consolidate further before a sustained breakout attempt can occur. If Ethereum can reclaim this moving average with strength in December, it would significantly increase the probability that the recent two-week correction has reached its bottom.
Ethereum is currently at a pivotal juncture: it must hold its current support structure and reclaim short-term resistance levels to avoid the risk of further downside. For the time being, the market is signaling resilience, and the upcoming weekly close will be a key determinant in whether this strength is sufficient to shift momentum back towards an upward trend.