

Market Overview
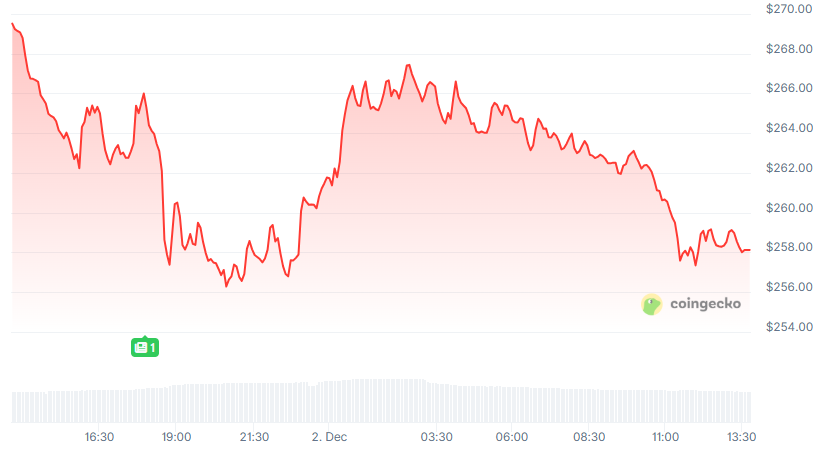
TAO is trading near $258.12, with ongoing weakness driving the price toward fresh lows. Selling pressure is accelerating, and prior consolidation zones are converting into resistance, leaving the market with thinning support.
- •TAO is moving lower as a failed multi-month range shifts into overhead supply, restricting upward attempts.
- •Liquidation data indicates that traders have repeatedly overleveraged during rallies, creating forced unwinds across major exchanges.
- •A recent tweet notes "More new lows.." as market structure weakens and lower support regions remain untested.
Breakdown Intensifies Below the Multi-Month Range
The chart illustrates TAO breaking decisively beneath a broad consolidation band where the price spent several months. This range previously acted as firm support, but repeated retests throughout late November produced weaker reactions. Each candle near the lower boundary formed smaller bodies, suggesting a lack of buyer interest.
Analyst Nebraskangooner noted through a tweet that "More new lows.." reflects the continued weakness seen after the breakdown. The move below the range confirms that structural demand has faded, leaving a vacuum that encourages further downside. The price now trades below the green shaded area, which has transitioned into overhead supply.
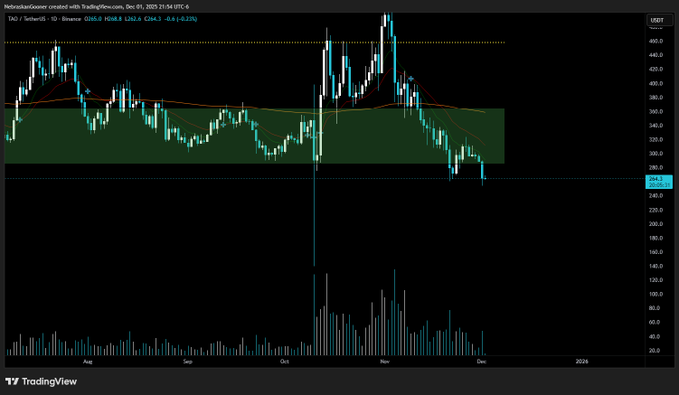
Moving averages further support this directional cue, as the shorter-term line has crossed beneath the longer-term line. Both are now sloping downward, forming a layered resistance band above. Any relief rally may struggle to move through these levels while sellers remain active.
Volume Structure Signals a Controlled Trend Continuation
Volume expanded sharply during the initial breakdown beneath the range, indicating conviction from market participants rather than a brief liquidation event. Subsequent sessions maintained firm volume, showing continued participation through each move lower.
Despite intermittent buying attempts, the price has not reclaimed the lost range. The inability to close back inside that zone signals that market participants continue to use upticks as exit opportunities. This trading behavior maintains pressure on the broader structure.
TAO’s current price action sits above a previous extreme marked by a long lower wick on earlier charts. However, the absence of strong reactions near this level suggests limited demand. The market structure shows a measured descent without signs of exhaustion.
Liquidation Patterns Reveal Heavy Leverage Unwinding
Liquidation data shows a market driven by aggressive leveraged participation. Throughout June to September, liquidation bars remained muted, matching the quiet price behavior. This shifted dramatically in early October during a sharp volatility burst that triggered the largest liquidation cluster.
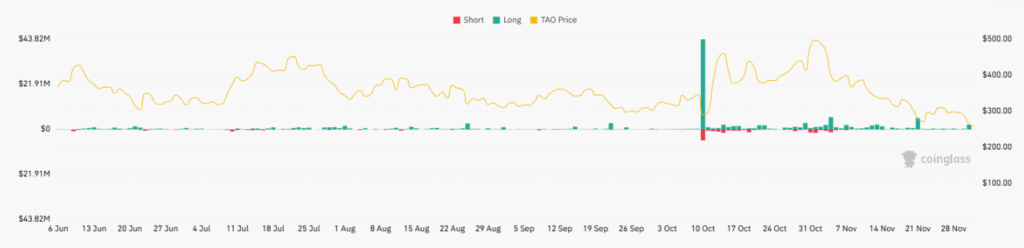
During the rally toward the $400–$500 region, both long and short liquidations increased. Traders attempted to chase strength or fade it, creating persistent unwind cycles. The frequent bars demonstrate how reactive positioning shaped each major move.
As TAO declined through November, long-liquidation spikes returned with each drop below $350 and $330. Open interest and volume concentration on Binance, MEXC, and Bitget demonstrate where most positions sat before unwinding. With TAO down 4.22% daily and 11.26% weekly, leveraged traders remain pressured in a weakening structure.