

Key Insights
- •Sui price jumped 20%, but the 3-month trend is still down more than 50%.
- •RSI, CMF, and OBV show weak support, so the rally may not hold.
- •A real trend change needs Sui crypto to break above $1.88 with strength.
Sui price moved up almost 20% in the last 24 hours. This erased most of the weekly loss and turned the 7-day move into a small gain.
However, the bigger picture remains weak because the SUI crypto is down more than 50% over the last three months. While the chart shows some strength today, it also displays signs that this jump may not be sustainable.
Sui Price Chart Shows a Breakout, but It May Not Be Real
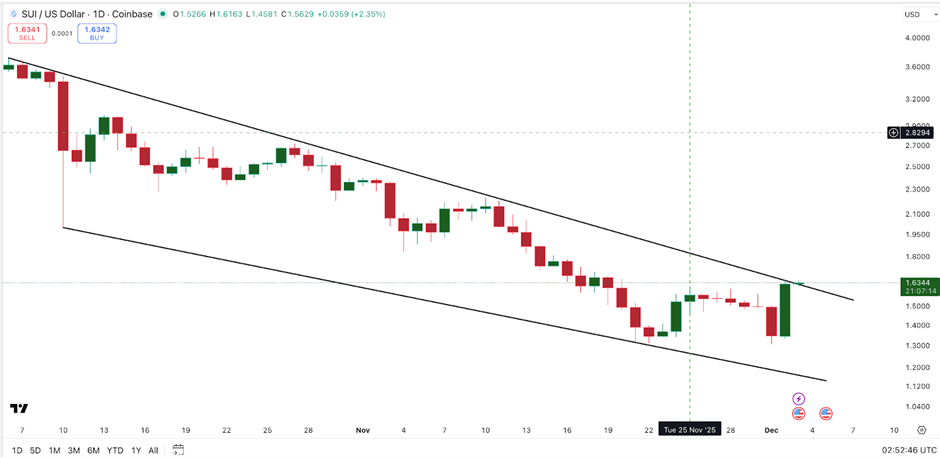
Sui price has been consolidating within a falling-wedge pattern since early October. This type of pattern often precedes a breakout, and the price has now pushed above its upper boundary. At first glance, this appears bullish.
However, the Relative Strength Index (RSI) presents a different narrative for the SUI crypto. The RSI is an indicator used to measure the speed and change of price movements, indicating whether the price is gaining or losing strength.
Between November 10 and December 2, the price formed a lower high, while the RSI simultaneously formed a higher high. This phenomenon, known as hidden bearish divergence, suggests that the downtrend may continue even if the price experiences a short-term rally.
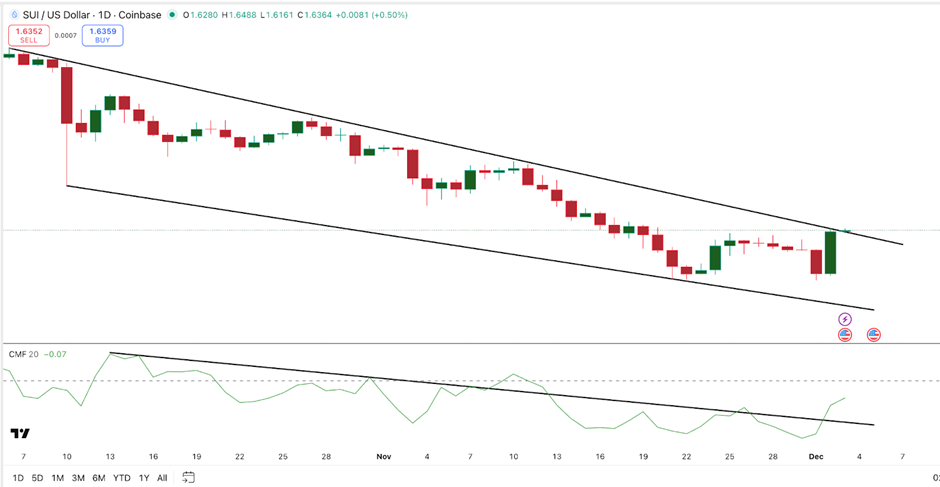
The Chaikin Money Flow (CMF), which assesses the level of buying and selling pressure by big market players, also shows mixed signals. The CMF broke its trendline during the recent rally, contributing to the upward price movement.
Despite this, the CMF remains below the zero line, indicating that significant buying activity has not yet materialized. A similar situation occurred in early November, where the CMF briefly broke its trendline, leading to temporary optimism, but the line never stayed above zero, and the price subsequently declined.
The most significant warning sign for a potential bull trap comes from the On-Balance Volume (OBV), an indicator that measures buying and selling pressure based on volume.
Since late October, the OBV has remained below a descending trendline and has not managed to break above it for the SUI crypto. More concerningly, from November 24 to December 2, the price registered a higher high, while the OBV formed a lower high.
This bearish OBV divergence implies that the current rally lacks sufficient underlying support. Collectively, these indicators suggest that the SUI price rally could ultimately prove to be a bull trap.
Analysts Say Bounce Is ‘Just Noise’
Market analysts are divided on the current price action. One prominent trader described the recent 8%–20% move as “just noise,” emphasizing that Sui remains significantly below a strong resistance area.

Another analyst noted the appearance of a buy signal on their trend-shift indicator, but cautioned that its validity depends on support holding firm. One chart analysis suggests that Sui price could revisit the $1.60 level, provided the current price zone remains stable.
For the SUI crypto to transform this current jump into a sustained upward trend, the price must decisively break above $1.88. This level corresponds to the 0.618 Fibonacci retracement, which has historically acted as a significant barrier for Sui. Without a clear move above $1.88, the chart's outlook remains predominantly bearish.
Should the current rally falter, the first level of support is identified at $1.66. A break below this level would then expose the price to further declines towards $1.53. Falling below $1.53 would place the price at risk of descending towards $1.31, effectively negating nearly all of the previous day's gains.
The technical indicators present numerous warning signs. The RSI exhibits hidden bearish divergence, the CMF remains below the zero line, and the OBV is showing weakness and moving counter to the price action.
Furthermore, the three-month trend continues to show a decline of over 50%. When considered together, these factors suggest that the recent breakout candle may not be sufficient to reverse the existing trend.
On the surface, Sui price appears to be performing strongly, but in the absence of substantial buying momentum behind the move, this 20% surge could still represent a bull trap. The price requires genuine confirmation above the $1.88 resistance level. Until such confirmation is achieved, the risk of a subsequent downturn remains elevated.