

Understanding the Familiar Chart Pattern
A familiar chart pattern is currently visible for SUI, reminiscent of a previous setup that preceded a significant rally. The price is situated near a long-running channel low, a level that historically proved to be a strong support. Traders observing SUI may find this pattern particularly noteworthy due to its past performance.
This analysis delves into the significance of this channel for SUI's price trajectory. The pattern was highlighted by Sui Intern, who referenced a chart created by Ali, a combination that enhances the understanding of this technical setup.
SUI Price and the Crucial Channel Low
The chart presented by Ali clearly illustrates a parallel to a prior market structure. In the past, the price touched a channel low and subsequently experienced a massive rally of 1,060%. Currently, SUI's price is again testing this channel support after a notable decrease of approximately 40% over the last month.
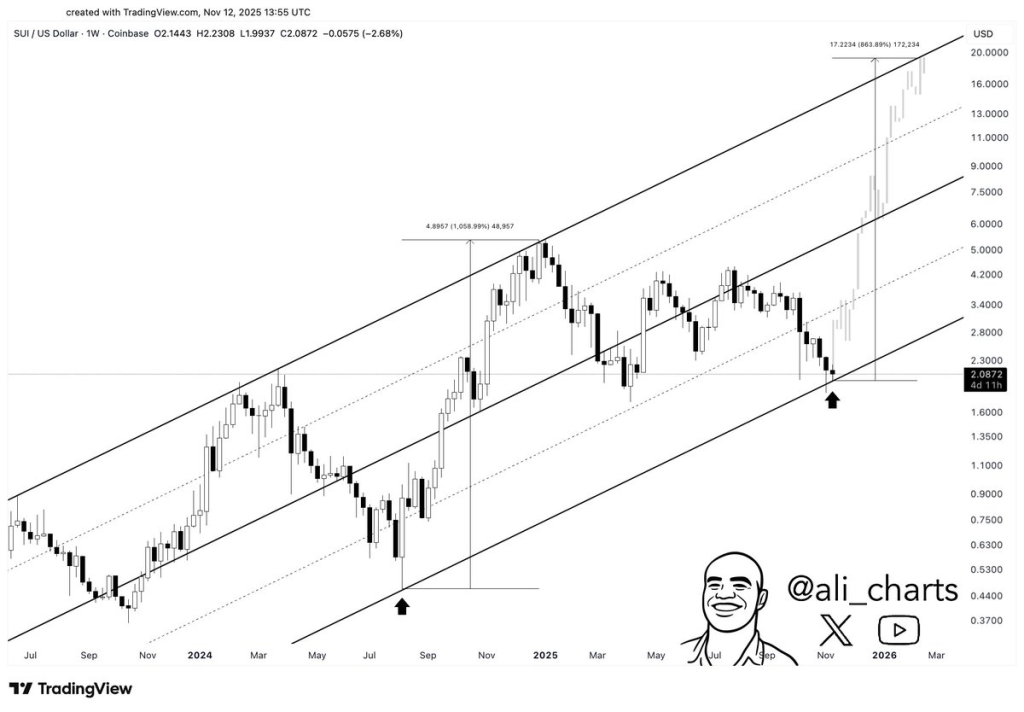
Trading near $1.81, SUI appears to be retesting the same structural support that was instrumental in its previous significant upward movement. Sui Intern shared a tweet drawing attention to this pattern, suggesting that if history repeats, a potential path towards $20 could emerge. This projection is contingent upon the price respecting the channel support and regaining momentum, similar to its past performance.
The previous explosive move serves as a benchmark for comparing the current structure. However, it is important to acknowledge that chart patterns can sometimes repeat and other times fail. This analysis aims to explain why the current setup appears familiar, rather than to guarantee future outcomes.
Sui Token Technical Picture From Ali’s Chart Analysis
Ali's chart displays weekly candles contained within a rising parallel channel. Historically, each time the price approached the lower band of this channel, buyers have intervened, driving the price upwards. Previous instances of price touching this support level were accompanied by strong weekly momentum and long green candles.
The current weekly candle is positioned near the lower band and a horizontal support line. This confluence of technical factors presents a straightforward risk-versus-reward scenario for technical analysts. Sui Intern utilized the prior explosive move as crucial context. Ali's visual representation effectively explains the significance of that previous low and why a repetition of such a move could be highly meaningful for the SUI token.
Sui Price: Insights from Weekly Indicators
The following table presents insights from weekly indicators regarding the present price action of SUI, as provided by investing.com:
| Name | Value | Action |
| RSI(14) | 36.132 | RSI is below the neutral area, indicating limited bullish momentum. This suggests that strength has diminished as price approaches support. |
| STOCH(9,6) | 50.577 | Stochastic is near the middle band, offering no clear directional signal. This implies that oscillators are awaiting a decisive swing before signaling a trend direction. |
| MACD(12,26) | -0.348 | MACD is below zero and the signal line area, reflecting that momentum currently favors sellers. Convergence or a cross would be necessary for bullish confirmation. |
| ADX(14) | 33.407 | ADX above 25 indicates trend strength. The current trend is downward while price tests support, meaning the trend remains significant even during a pullback. |
| Ultimate Oscillator | 52.479 | Ultimate Oscillator is above the midpoint, hinting at some buying pressure. This could signal early accumulation near support, even as other indicators remain cautious. |
Indicator Alignment with Price Action
The weekly indicators present a mixed momentum picture for SUI. An RSI close to 36 suggests weak momentum but does not indicate deeply oversold conditions. This aligns with the current channel test, where sellers have pushed the price lower without breaking the established structure. The Stochastic oscillator also resides in the middle zone, showing no strong directional bias and reflecting market hesitation as the price moves toward support.
Momentum tools lean bearish but offer signs worth monitoring. The MACD remains negative, confirming the recent pullback and explaining the need for price to cool off after previous strength. However, a shrinking negative histogram or an upward cross would signal a shift in momentum. An ADX value above 33 indicates a strong trend, which still favors sellers. This suggests that a breakdown below the channel low could lead to further losses unless buyers intervene and weaken the trend.
Subtle bullish pressure is still evident. The Ultimate Oscillator holding above 50 suggests short-term buying interest as the price interacts with long-term support.
The critical development to watch now is what occurs at the channel low. A strong weekly close back above the mid-channel would indicate buyers regaining control. Conversely, a failure to hold at support could open the door to further downside. More definitive signs of a reversal would become apparent if oscillators begin to turn higher as the MACD's downside momentum starts to fade.