

Key Support and Resistance Levels for XLM
Stellar ($XLM) is currently testing a critical support level at its ascending trendline, with the price hovering around $0.241. This area has historically proven to be a significant support zone. If $XLM successfully bounces from this level, analysts predict a potential push towards the resistance zone situated between $0.26 and $0.27, a level that has previously acted as a price ceiling.
CryptoPulse analysts emphasize the importance of this support level, stating that confirmation of support at the trendline is essential for a bullish continuation. Without this confirmation, the asset might experience further consolidation or a breakdown below the trendline, leading to a subsequent price decline.
$XLM Sitting on Trendline Support — Bounce Incoming? $XLM is currently holding above its ascending trendline on the 4H chart, showing early signs of a potential bounce from this area. If buyers step in, the next key level to watch is the major resistance zone at… pic.twitter.com/PSJIOKbjUj
— CryptoPulse (@CryptoPulse_CRU) December 7, 2025
Bullish Signals Amid Falling Wedge Formation
Altcoin Pioneers are highlighting bullish signs observed in the formation of a six-year falling wedge pattern for $XLM. This technical pattern is often indicative of a potential breakout once the price successfully moves above its upper boundary.
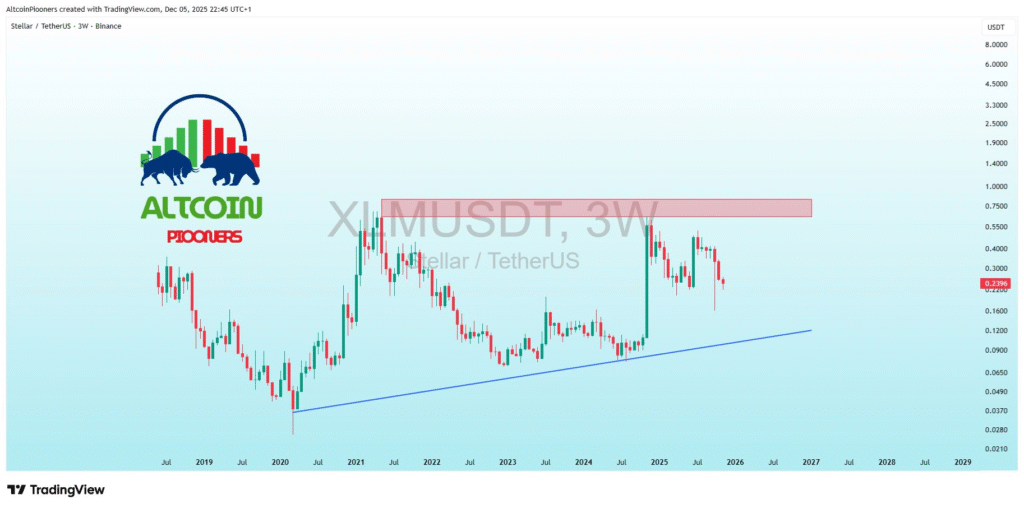
Currently trading at $0.229, XLM has repeatedly tested the lower boundary of the falling wedge, signaling robust support. Technical indicators further support a bullish outlook. The Relative Strength Index (RSI) is in the oversold zone, suggesting that buying pressure may soon increase. Additionally, the Moving Average Convergence Divergence (MACD) is exhibiting bullish divergence, pointing towards a potential shift in momentum towards the upside.
Analysts propose that if $XLM breaks above the $0.35–$0.40 resistance range, short-term price targets could be set between $0.75 and $0.90. Conversely, a price drop below $0.15 would invalidate this bullish breakout scenario.
Breakout Potential for XLM
A sustained hold above the trendline support could trigger a significant breakout for $XLM, leading to higher price levels. The confluence of the rising trendline and the falling wedge pattern has captured the attention of traders and analysts who are closely monitoring these key price levels.
A confirmed breakout has the potential to unlock further gains, possibly pushing the price towards the $0.75–$0.90 range. However, it is crucial to see confirmation of support and a decisive break above the upper boundary of the falling wedge to validate these optimistic projections.