

TD Sequential Indicator Flashes Buy Signal for Solana
Solana ($SOL) is showing signs of a significant price reversal, as indicated by a powerful buy signal from the TD Sequential indicator. This indicator has a history of accurately predicting trend shifts for Solana, suggesting it may forecast the asset's next significant price movement.
The TD Sequential indicator is known for its reliability in identifying key market turning points. It functions by counting down a sequence of numbers, with a "9" signal typically marking the completion of a cycle and often preceding a trend reversal. This particular signal has been observed to have a high success rate in pinpointing price reversals.
Historical data shows multiple instances where "9" signals on the TD Sequential indicator coincided with important price peaks, followed by subsequent declines. For example, a "9" signal in March 2023 preceded a top in Solana's price and a sharp drop. Another "9" appeared in June 2023, again signaling a market top and a subsequent correction. The most recent "9" signal suggests that the market may have potentially bottomed out and is poised for a change.
According to analysis from @ali_charts, these signals have consistently demonstrated a high success rate in identifying price reversals. The current chart pattern, with the latest "9" signal, points to a potential buying opportunity for investors.
Is a Major Rally Imminent for Solana?
The significance of this TD Sequential buy signal is amplified by its historical accuracy in predicting Solana's price action. Following several "9" signals that led to price corrections, the current indicator suggests that Solana is prepared for a substantial rally. The latest "1" and "9" signals indicate that Solana may be oversold, and the market could be anticipating an upward reversal.
With Solana currently trading around $128, market participants are closely observing whether this buy signal will yield the positive outcomes seen in the past. If confirmed, a price rally towards $150 or even $200 could be on the horizon, presenting a potentially profitable opportunity for investors. However, in the highly volatile cryptocurrency market, it is crucial to seek further confirmation before executing significant investment decisions.
Supporting Technical Indicators Align with Buy Signal
Beyond the TD Sequential indicator, other technical indicators on Solana's daily chart also suggest that a trend reversal may be imminent. Currently trading at approximately $128.64, Solana is encountering resistance from the upper Bollinger Band, which is positioned around $146.01, while the lower band at $125.17 is providing strong support.
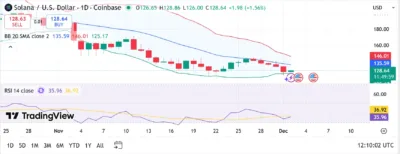
The Relative Strength Index (RSI) is currently hovering around 36.92, indicating that Solana is approaching oversold conditions. Historically, when the RSI falls below 40, the market has often shown a tendency to recover, which further supports the case for a potential upward price movement. With the price recently testing the lower Bollinger Band and the RSI suggesting a possible reversal, traders may interpret this as a confirmation of the buy signal, signaling that Solana is poised for a rebound.