

As the cryptocurrency market continues to regain momentum in early 2026, Solana (SOL) is once again standing out as one of the strongest performers among major blockchains. Over the past 30 days, SOL has climbed nearly 17%, and the rally is not being driven by price speculation alone. On-chain data and user activity suggest that the network’s fundamentals are strengthening alongside the recovery.

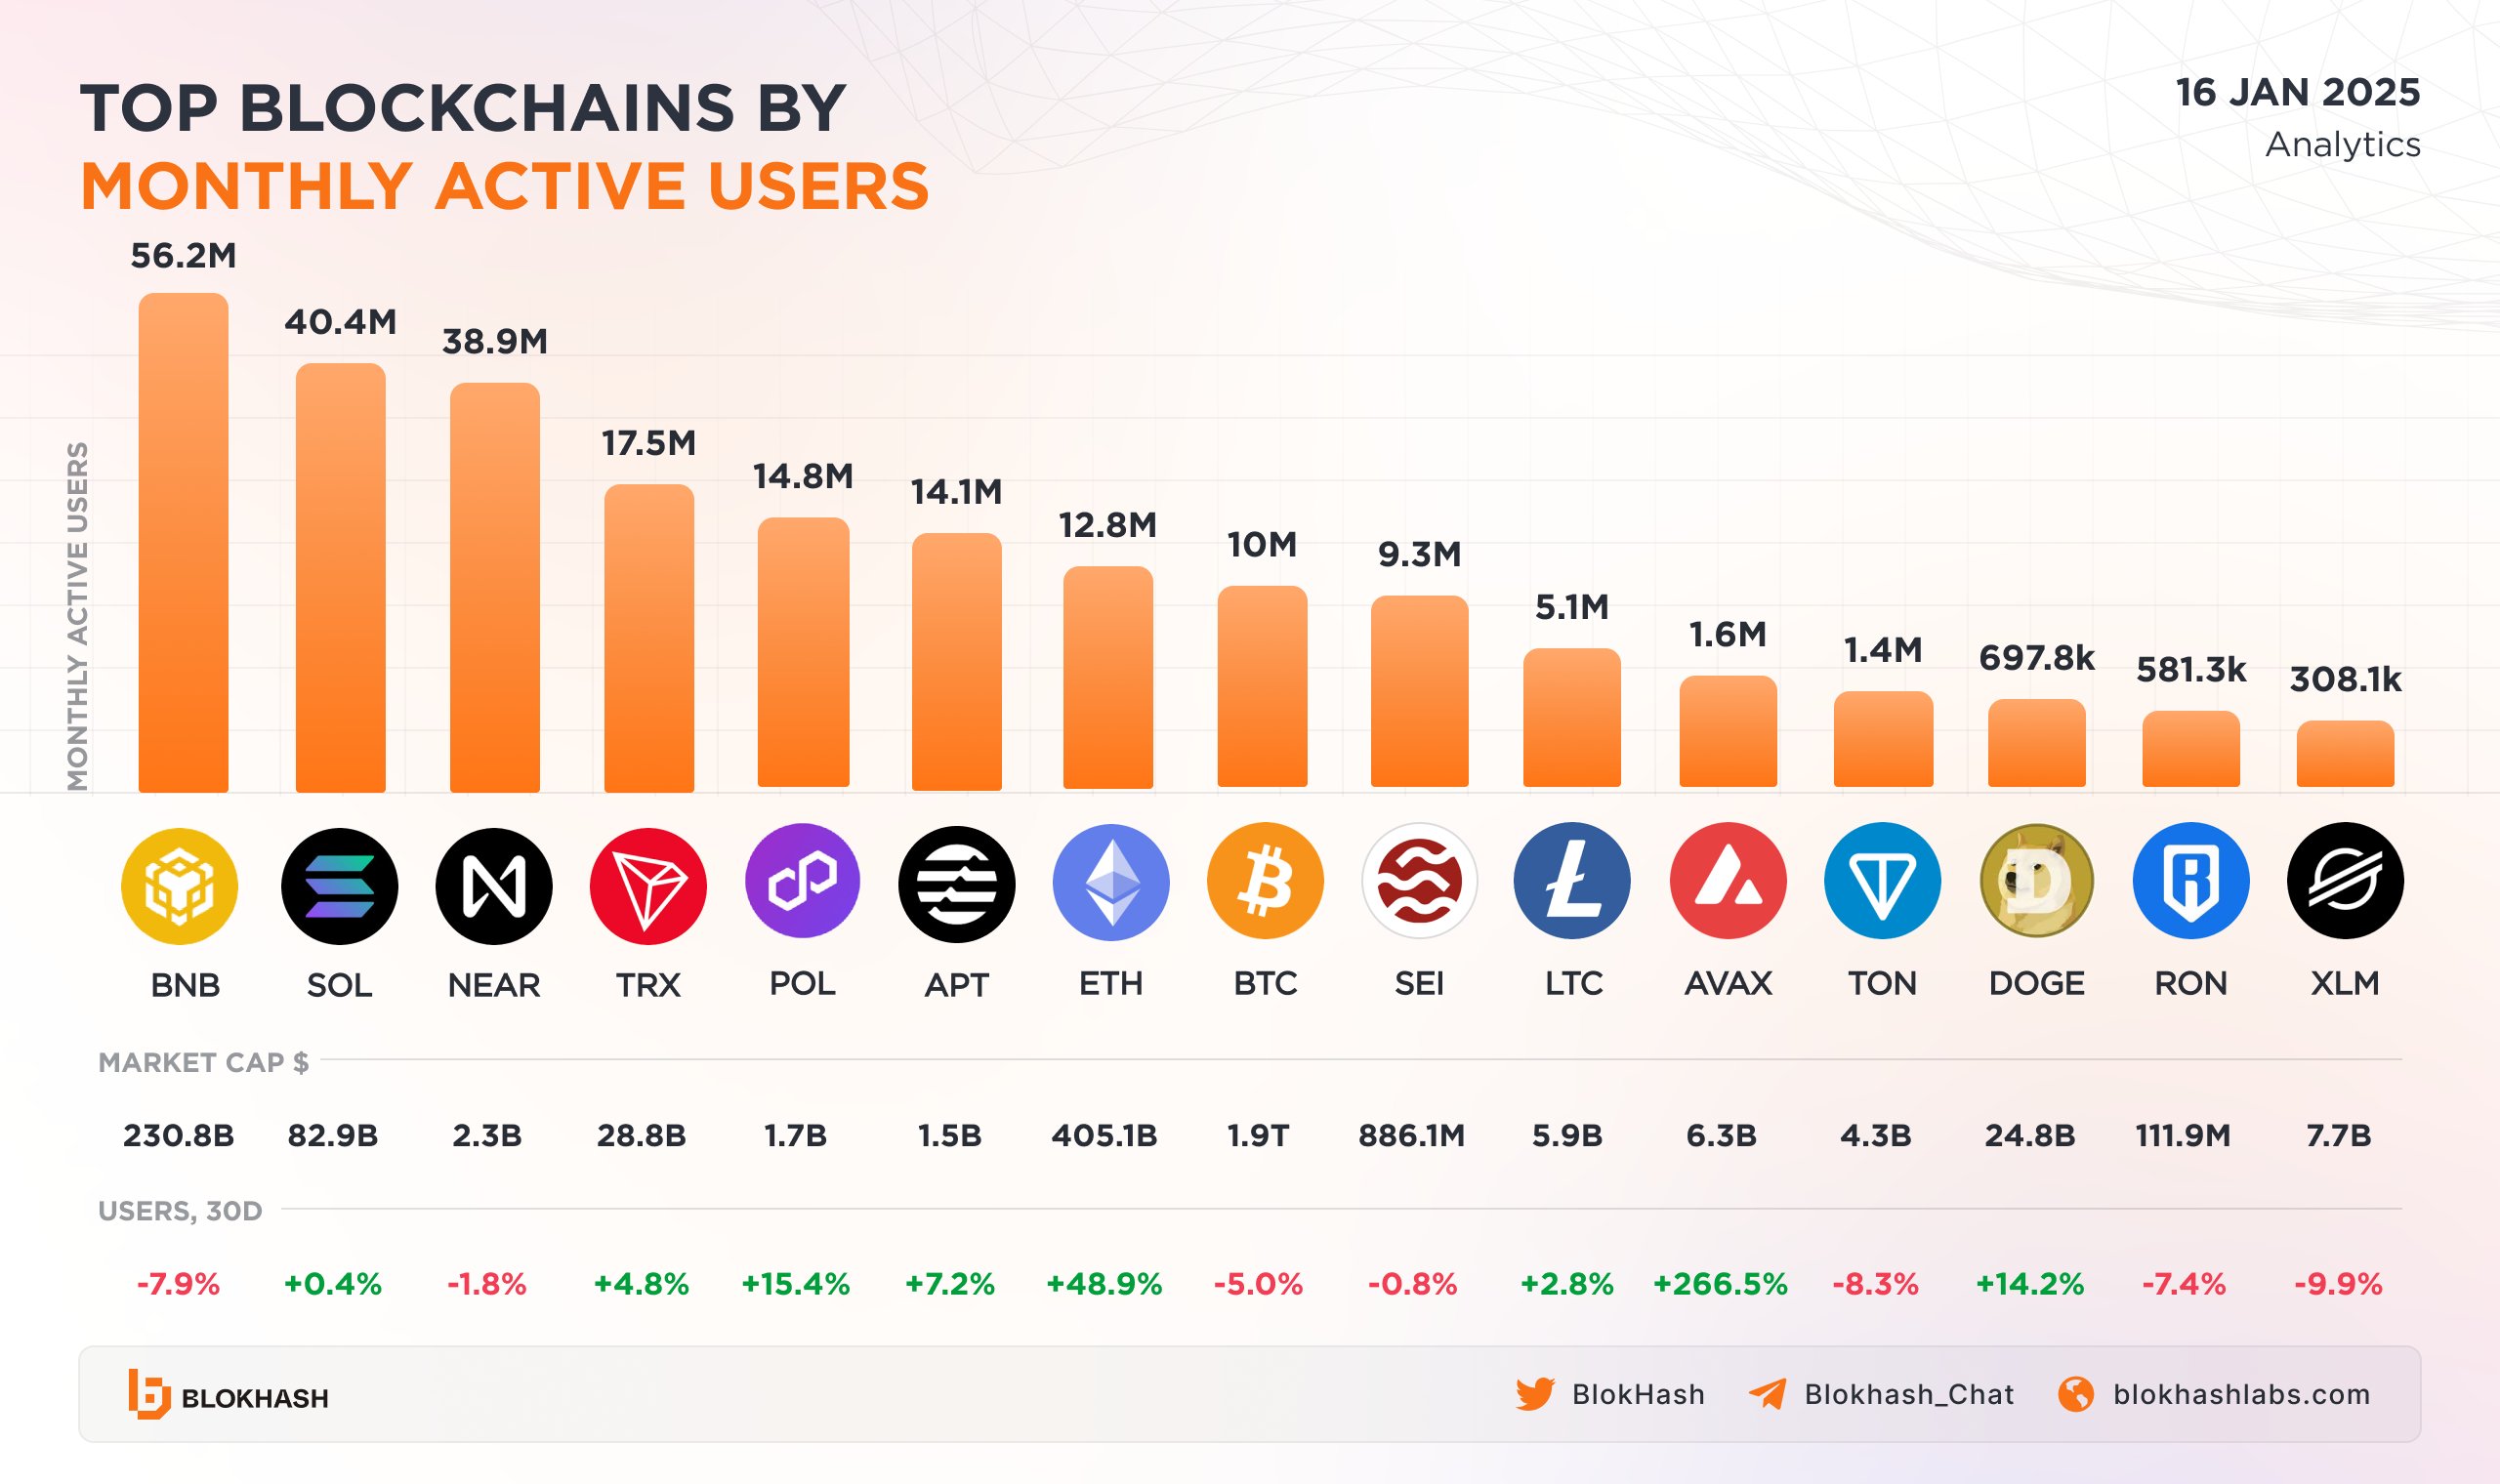
Top Blockchains by Active Users
Solana is currently ranked as the second most active blockchain, recording around 40.4 million monthly active users, trailing only BNB Chain. This surge in activity highlights growing adoption across DeFi, NFTs, and on-chain applications, reinforcing Solana’s position as a leading Layer-1 ecosystem in the current market cycle.
Technical Patterns Hint at Further Upside
From a technical perspective, SOL’s daily chart presents an interesting setup. The price action has formed a Bearish Shark harmonic pattern, a structure often associated with trend exhaustion at its completion point. However, before that reversal zone is reached, the pattern typically allows room for continued upside.
At present, SOL is trading near $144, consolidating just below a critical technical level. A successful reclaim of the 50-day moving average, which sits slightly above the current price, could act as a trigger for the next leg higher.
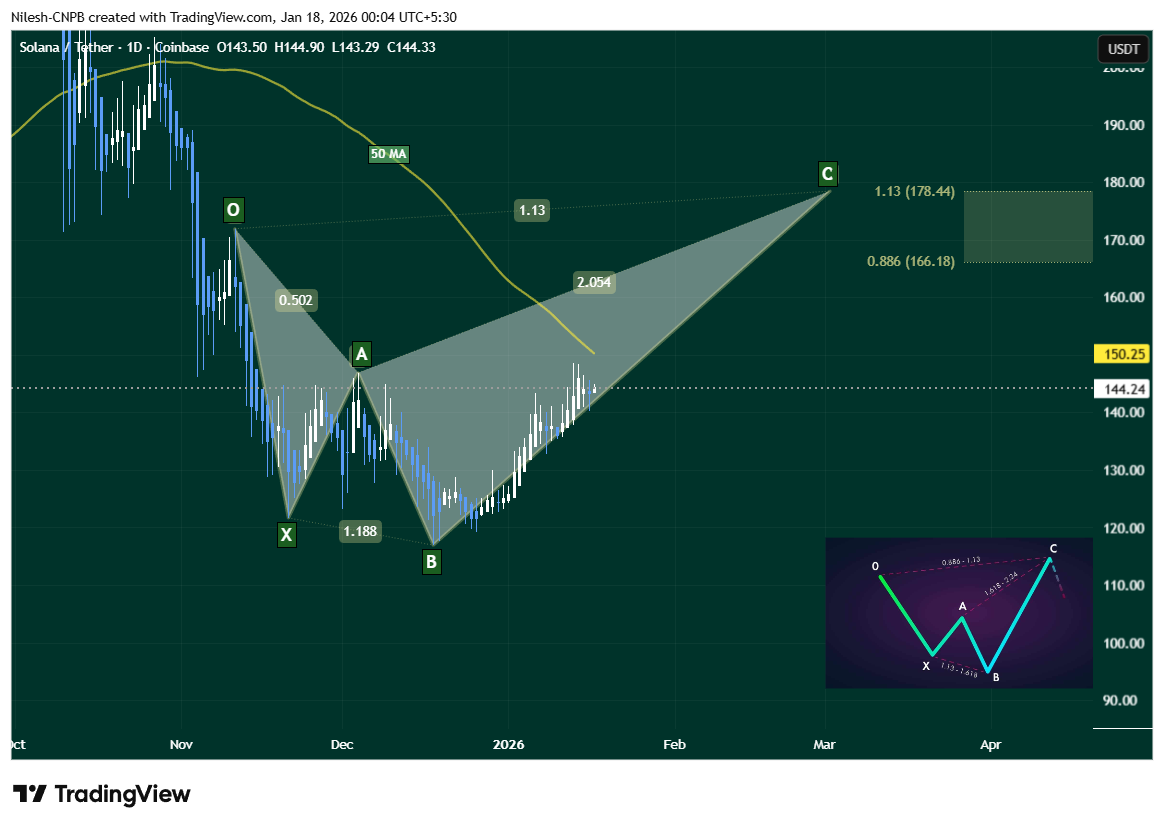
Based on the harmonic structure visible on the chart, SOL’s price is projected to move toward the $166.18 to $178.44 range, which represents the Potential Reversal Zone (PRZ) of the Shark pattern. These levels align closely with the 0.886 and 1.13 Fibonacci extensions, commonly used to estimate the completion of the pattern’s final “C” leg.
If this scenario plays out, SOL could see an upside move of roughly 23% from current levels, assuming broader market conditions remain supportive.
Importantly, the higher-low structure formed since the December bottom suggests improving momentum, while the steady slope toward the PRZ indicates controlled, healthy buying pressure rather than a parabolic move.
Bottom Line
Solana’s strong user growth, combined with a technically constructive chart setup, places the token in a favorable position as 2026 unfolds. While the Bearish Shark pattern signals caution near the $166–$178 zone, the path toward that level remains open as long as SOL holds above recent support and reclaims its key moving average. For now, Solana appears well-positioned to extend its recovery before facing its next major technical test.