

The Solana price has experienced a 5% decline in the last 24 hours, trading at $158 as of 5 a.m. EST. This downturn is occurring despite a 3% drop in trading volume, which now stands at $5.67 billion.
This price movement comes as Grayscale, a prominent fund management titan, announced the launch of options trading for its Solana ETF, known as GSOL.
JUST IN: @NYSE activates options trading for GSOL and BSOL, Solana's listed ETFs. pic.twitter.com/6UZ7kmyN4P
— Solana (@solana) November 11, 2025
The GSOL ETF, now featuring options contracts, presents investors with a compelling offer: staking rewards exceeding 7% annually and a zero management fee structure. This combination provides GSOL with a significant competitive advantage and could attract new investors, even with ongoing concerns about SOL price volatility.
Grayscale Expands Solana #ETF Access with Options Trading Launch
Grayscale has introduced options trading for its Solana Trust ETF (GSOL), giving investors more ways to manage exposure to Solana’s expanding ecosystem. The move adds flexibility for traders seeking to hedge… pic.twitter.com/hlcDaxrKiT— Muhammad Nabeel🔸 (@Beyoglu124) November 11, 2025
In a statement, Grayscale indicated that the new options products offer investors enhanced flexibility for hedging, risk management, or capitalizing on price fluctuations.
Industry experts in the cryptocurrency space interpret this development as a growing endorsement of Solana's long-term prospects on Wall Street. It is believed that this could accelerate liquidity and price discovery throughout the entire Solana ecosystem.
Solana Coin Price Under Pressure
Following a recent peak near $171.94 this week, the SOL price has declined and is currently stabilizing just above the $158 mark. The asset is down approximately 5% for the day and is experiencing downward pressure.
While fundamental strength is evident, the market is still in the process of evaluating the impact of recent developments. On-chain data presents a mixed outlook. The past week has seen a 10% increase in active addresses and an 8% rise in transaction volume, indicating robust network activity and user engagement.
Solana continues to lead the blockchain sector in DEX (decentralized exchange) volume, processing $29 billion in weekly trades and handling over 543 million transactions during the same period. This strong performance is crucial for Solana, differentiating it from competitors such as Ethereum and Base.
The Solana ecosystem continues to demonstrate significant growth. Network fees reached $8.5 million in a single week, with app-related revenue climbing to $23 million. Solana also boasts 15 million active users, a figure that underscores its widespread adoption and long-term sustainability.
Institutional inflows into Solana ETFs have amounted to $7.9 million in just 11 days, a statistic that most analysts view as an indication of significant capital investment in the network's long-term growth potential.
Technical Analysis: SOLUSDT Price Prediction
Examining the latest SOLUSDT chart, Solana is currently in a consolidation phase after experiencing sharp declines. The price is trading just above key support levels around $158. Important moving averages are under scrutiny: the 50-week SMA is positioned at $179.05, while the 200-week SMA remains firm at $102.26.
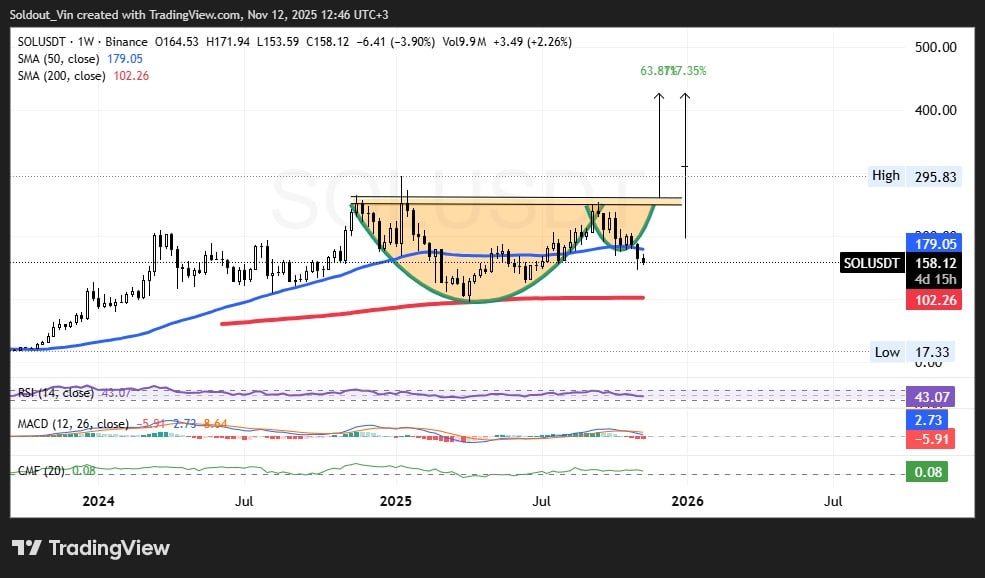
SOLUSDT Analysis Source: Tradingview
The current price is trading below the 50-week SMA, yet it remains well above the longer-term average. This suggests that sellers have not yet fully established control over the market.
Key technical levels indicate that support between $158 and $161 is providing some stability. Significant resistance is observed in the $175–$179 range, with another strong resistance level at the previous high of $295.83, which would necessitate a substantial reversal to be challenged again.
Bollinger Band indicators suggest a period of low volatility and potential accumulation, implying that buyers might enter the market if new ETF inflows continue.
The Relative Strength Index (RSI) is positioned near neutral territory, registering 43 on the weekly chart and 32.5 on the daily chart. Currently, there is no clear momentum indicating an imminent bullish breakout.
The Moving Average Convergence Divergence (MACD) indicator shows a bearish trend but is not in oversold territory. If the price can maintain its position above $158 and successfully break through the $179 resistance, SOL has the potential to rally towards $230 and possibly target $295 in the upcoming months, particularly if new institutional investment drives demand.
A "Cup and Handle" pattern is observable on the weekly chart, suggesting that if SOL can reclaim key resistance levels and trading volume increases, an upward movement is possible. Projected gains from the completion of this pattern could lead to an upside of up to 63%, potentially reaching the $295 level. However, this outcome is contingent on broader cryptocurrency market sentiment and the sustained presence of institutional flows.
For the time being, traders and investors are closely monitoring the $158 support level. A breach below this level could trigger further selling pressure, potentially driving the price down to $102, which represents the next significant support zone.
With options trading poised to gain momentum and staking rewards attracting attention, Solana remains one of the most closely watched cryptocurrencies in the current market landscape.