
The Solana price surged 1.6% in the last 24 hours to trade at $187 as of 3:30 a.m. The surge occurred despite an 11% fall in trading volume to $7.13 billion.
This upward movement follows the significant news that Hong Kong has become the first jurisdiction globally to approve a spot Solana Exchange Traded Fund (ETF). This development positions Hong Kong ahead of the United States, where approvals for similar products are facing delays due to ongoing governmental processes.
🚨 JUST IN: 🇭🇰 Hong Kong has officially approved the first-ever $SOL Spot ETF by ChinaAMC!
Solana just joined the big leagues — institutional money is coming 🟣🔥#Solana#Crypto#ETFpic.twitter.com/y7CUN32aJW
— SMC KAPIL DEV (@smckapildev) October 22, 2025
The approval represents a major milestone for the Solana ecosystem and its community. The newly approved ETF, managed by ChinaAMC, is scheduled to commence trading on the Hong Kong Stock Exchange on October 27. Investors will have the flexibility to purchase shares of the ETF using U.S. dollars, Chinese yuan, or Hong Kong dollars.
In a move that positions Hong Kong as a frontrunner in cryptocurrency innovation, this decision is anticipated to attract significant new capital into Solana from both retail and institutional investors. This is particularly noteworthy as regulatory bodies in the United States continue to deliberate on similar investment products.
Solana Price: On-Chain Trends
The price dynamics of Solana (SOL) have been significantly influenced by a robust wave of on-chain activity. Data analysis indicates that despite a market downturn experienced earlier in October, key metrics such as wallet growth, transaction volume, and staking participation continue to demonstrate a healthy ecosystem.
Solana's on-chain statistics remain a primary driver of increasing investor interest. Recent blockchain analytics reveal a consistent rise in the number of new wallet addresses created and an overall increase in network transactions, suggesting heightened user engagement and network utility.
Furthermore, an observable trend shows more SOL coins being transferred from exchanges to private wallets. This behavior is often interpreted as a signal that long-term holders are accumulating assets rather than engaging in immediate selling.
The number of SOL tokens being staked is also on an upward trajectory, which contributes to investor confidence in the network's security and its future prospects.
Industry experts highlight that these on-chain signals are closely monitored by traders. A rise in network activity, especially when coupled with positive news events like the ETF launch, can potentially lead to new price highs for SOL. Consequently, the cryptocurrency's price may benefit not only from speculative interest but also from genuine adoption and increased usage on the Solana blockchain.
Solana Technical Analysis: Key Levels To Watch
From a technical analysis perspective, Solana's price is currently holding above critical support levels and remains within an ascending trend channel. The weekly chart indicates that SOL is trading just above two significant simple moving averages (SMAs): the 50-period SMA at $183.20 and the 200-period SMA at $102.00.
These SMAs are commonly utilized by traders to assess market direction and the strength of prevailing trends.
The $183.20 price level is currently acting as the first major area of support, reinforced by the 50-period SMA. Historically, when the price approaches this level, new buyers have frequently entered the market, helping to push the price higher.
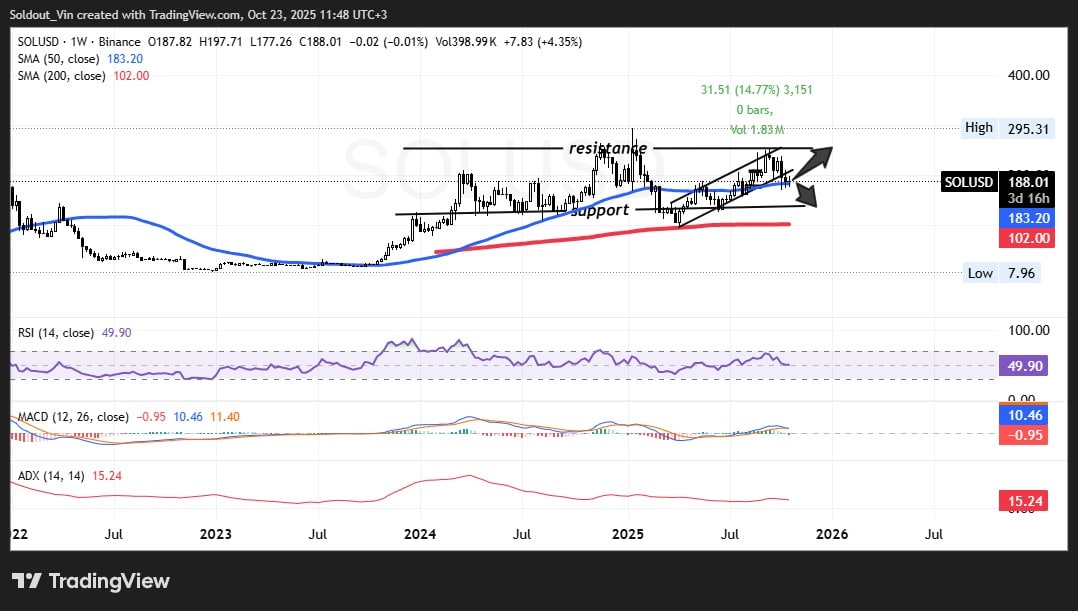
A breach below the $183 support zone could potentially lead to a retest of the next significant support level around $102, which is indicated by the 200-period SMA. However, such a decline would likely attract substantial demand from long-term investors.
Resistance is currently observed in the vicinity of $195 to $200. A decisive break above this resistance barrier could trigger a price movement towards the previous high of approximately $295. If the ETF launch generates a more pronounced positive price reaction, these price targets could be reached more rapidly.
Solana Price Indicators Turn Bullish Ahead
Technical indicators are also displaying optimistic signals for Solana's price. The Relative Strength Index (RSI) is positioned near the 50 mark, suggesting that the asset is neither overbought nor oversold, thus leaving room for potential price movement in either direction.
The Moving Average Convergence Divergence (MACD) indicator is situated close to the neutral zone but is showing a gentle upward turn. This could be an early indication that buyers may begin to gain dominance if the current trend strengthens.
While the Average Directional Index (ADX), currently at 15.24, suggests that the trend is not exceptionally strong at this moment, an increase in this indicator could signal the commencement of a significant price swing.
The price chart illustrates an upward trend, with a clearly defined support area marked by a rising black line and resistance at the upper boundary of the channel. As Solana's price fluctuates within these parameters, the overall outlook remains positive, provided that the established support levels are maintained.
Should the price successfully break above the upper resistance line of the channel, the next primary target would be $218, with a potential to reach previous highs around $295.
Conversely, if the price encounters resistance or if profit-taking pressures emerge in the market, traders should closely monitor the $183 and $102 levels for signs of support and sustained long-term buying activity.