
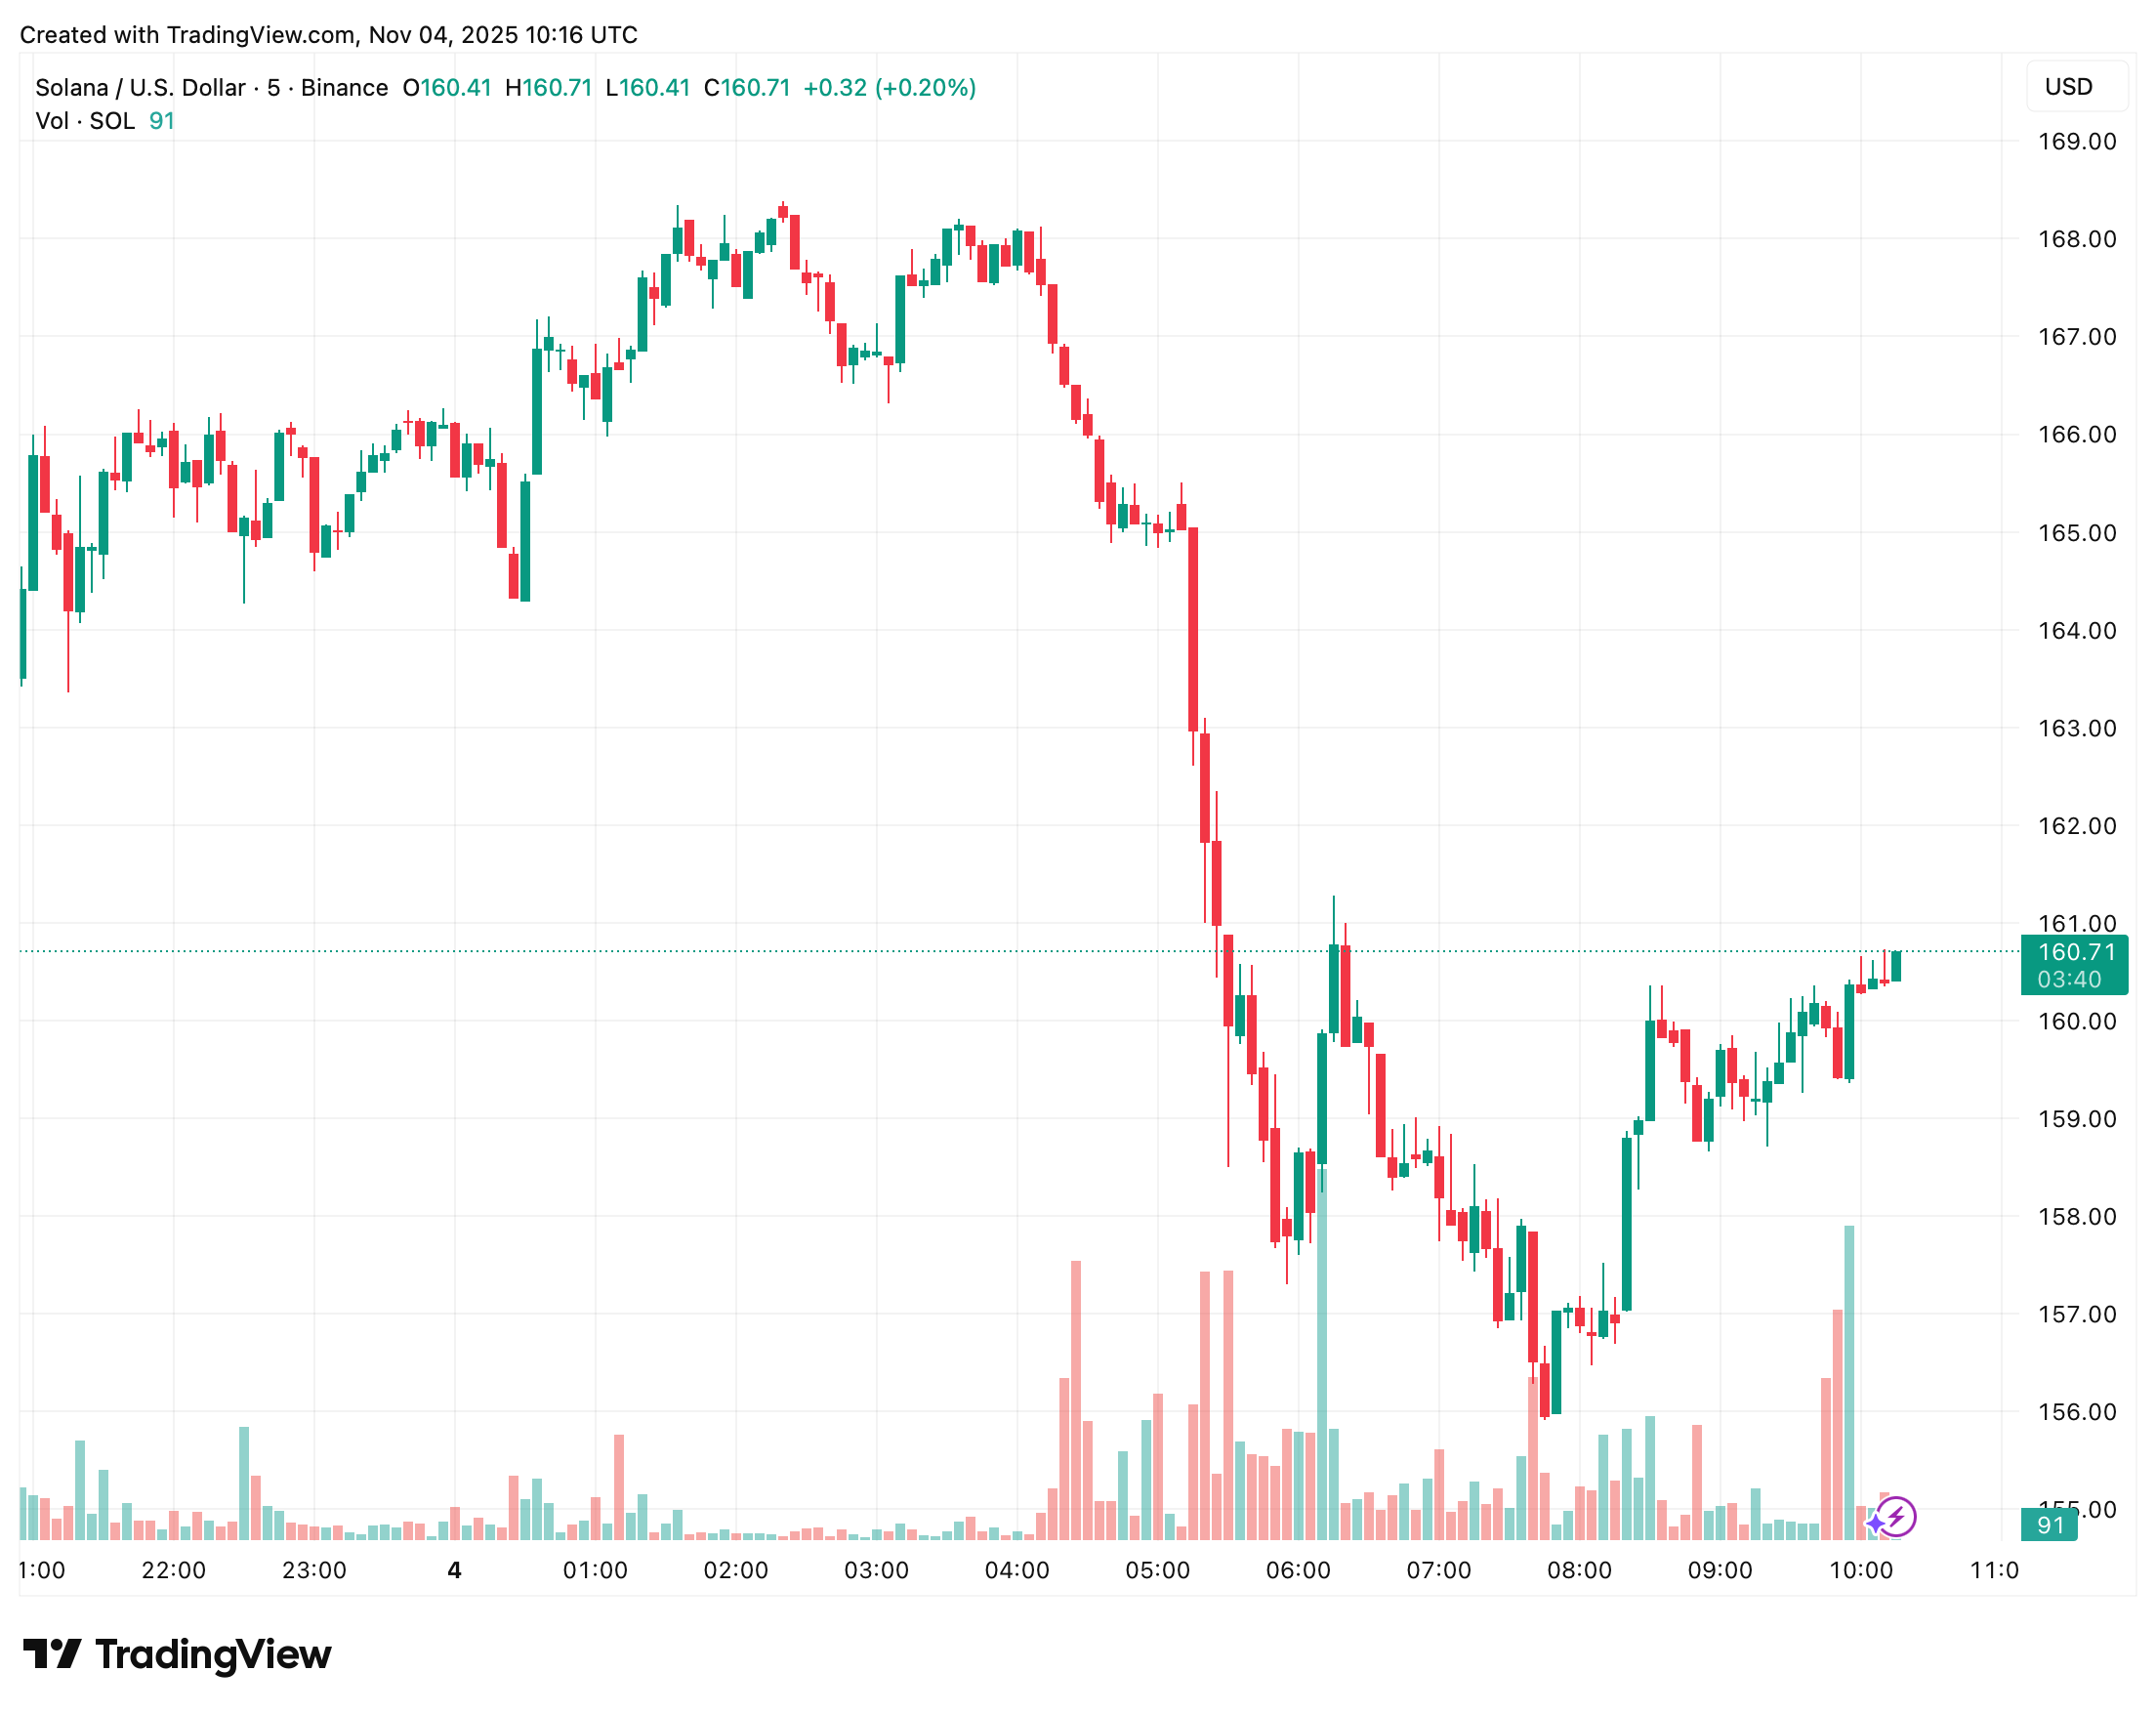
Solana (SOL) experienced a significant decline over the past 24 hours, falling 8.48% to $160.57. This downturn occurred as the broader cryptocurrency market faced pressure from macroeconomic factors, instability within the DeFi sector, and widespread liquidations. During this period, the total cryptocurrency market capitalization decreased by 3.9% to $3.45 trillion. Major cryptocurrencies like Bitcoin and Ethereum also saw declines, with Bitcoin trading below $104,000 and Ethereum falling below $3,500.
Macroeconomic Weakness and Market Fear
Investor sentiment has shifted into a state of "Extreme Fear," as indicated by the Crypto Fear & Greed Index, which dropped to 27. Significant outflows from Bitcoin ETFs, totaling $186.5 million, further contributed to risk aversion, prompting traders to reduce exposure across major altcoins. Solana, being a high-beta asset, tends to amplify Bitcoin's price movements, and this recent pullback reflects that correlation. Futures funding rates for SOL have decreased by 62.84% week-over-week, suggesting a reduction in demand for leveraged long positions. Analysts emphasize that Bitcoin's ability to maintain support at the $103,500 level will be crucial for Solana's stabilization.
DeFi Contagion Adds Pressure
Solana's decentralized finance (DeFi) ecosystem is currently under renewed strain due to broader contagion fears. Stream Finance reported losses amounting to $93 million, contributing to a total of $284 million in bad debt across various lending protocols. Experts warn that this situation could lead to a cascade of forced liquidations within the DeFi sector. Solana's current DeFi Total Value Locked (TVL) stands at $4.1 billion, and an acceleration of outflows is being observed as users withdraw their positions. The network processed $4.3 billion in decentralized exchange (DEX) volume yesterday; however, a further reduction could negatively impact staking yields and validator rewards, which are significant drivers of long-term token demand.
Technical Breakdown and Trading Behavior
Solana's price has fallen below key technical support levels, including the pivot point at $172.79 and the 200-day simple moving average (SMA) at $179.75. This technical breakdown confirms a short-term bearish trend. The Relative Strength Index (RSI) is currently at 33, indicating potential oversold conditions, while the MACD reading, at -6.4 against a signal line of -5.48, shows ongoing bearish divergence. On the four-hour chart, both the 50-day and 200-day moving averages are trending downwards, reinforcing the bearish structure. While this typically suggests sustained selling pressure, an oversold RSI could potentially trigger a relief bounce if Bitcoin experiences stabilization. Traders are closely monitoring for a daily close above $163.55, which corresponds with a significant Fibonacci retracement support level.
Institutional vs. Retail Divergence
A notable divergence is apparent between institutional and retail investor sentiment. Institutional entities continue to demonstrate confidence in Solana, with ETFs linked to the cryptocurrency experiencing consistent inflows. In contrast, retail participation has seen a sharp decline, with smaller traders seemingly taking profits or exiting volatile positions, thereby contributing to the short-term price weakness. Concurrently, futures funding rates have turned negative, indicating that short traders are compensating long traders, a sign of increasing bearish sentiment in the derivatives market.
Medium- to Long-Term Outlook
Despite the current market downturn, analysts maintain a constructive outlook on Solana's long-term prospects. The blockchain continues to exhibit strong fundamental indicators, including high transaction throughput, low fees, and growing institutional adoption. Should market conditions stabilize and DeFi outflows subside, SOL could potentially aim to regain the $170–$180 range later in the current quarter. In the immediate term, elevated volatility is expected, with traders observing $157 as a near-term support level and the $163–$165 band as a critical resistance zone to watch for signs of a potential rebound.