

Solana Tracks Toward a Key Support Zone
Solana trades at $138.30 after a moderate 24-hour pullback, and market participants are focused on a structural support level at $135. This level has aligned with earlier market structure and remains untested during the recent move upward. Traders now view the area as a potential zone for renewed activity if price revisits it.
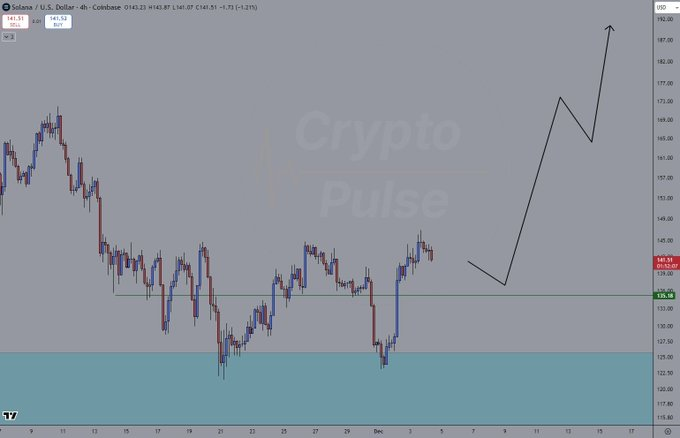
A recent post from CryptoPulse_CRU noted that price has not tapped the support level. The commentary explained the value of waiting for price to return to the zone before considering new entries. The chart referenced showed a projected retracement path toward $135, suggesting a staged pullback before a new advance forms.
Earlier sessions showed a sharp rebound from a broad accumulation zone marked by strong buyer activity. That region created the first strong rotation candle that shifted short-term structure. The move away from that zone produced new higher lows, which kept the structure intact during recent fluctuations.
Market Activity Shows Controlled Volatility
As of writing, data shows Solana moving from highs near $143.56 before forming several weak recovery attempts. Each attempt failed to reclaim short-term intraday structure, which kept price contained within the current range. A sharper dip mid-session later stabilized in the high-130s, reflecting controlled volatility rather than a strong trend reversal.
Volume has dropped to $4.03B, representing a reduction of about 21.54%. This shift often appears when participants step back during slower phases of the trend. Lower activity can reflect caution among buyers rather than aggressive selling pressure, allowing price to move without strong directional force.
Basic measures are stable, and Solana has a market cap of $77.43B. Circulating supply is near 559.89M SOL and the fully diluted valuation is $85.12B. These numbers reflect a steady production base at the last pullback and retain the bigger picture.
Ecosystem Commentary Adds Context to Technical Structure
A detailed chart breakdown from CryptoPulse_CRU described the accumulation block below recent lows as a strong reaction zone. That zone produced a decisive bounce, showing that liquidity had already been collected beneath key levels. The commentary noted that the next liquidity area sits near the untested support.
The chart also showed compressive movement between $135 and upper resistance levels. This pattern allows room for a controlled revisit without shifting the broader trend. Structure in recent sessions shows repeated respect for key points, reinforcing interest around the support.
Market sentiment around Solana’s ecosystem remains active, with ongoing discussion around structural setups and upcoming activity. These elements continue to frame trader expectations as price moves toward a potentially important area.