
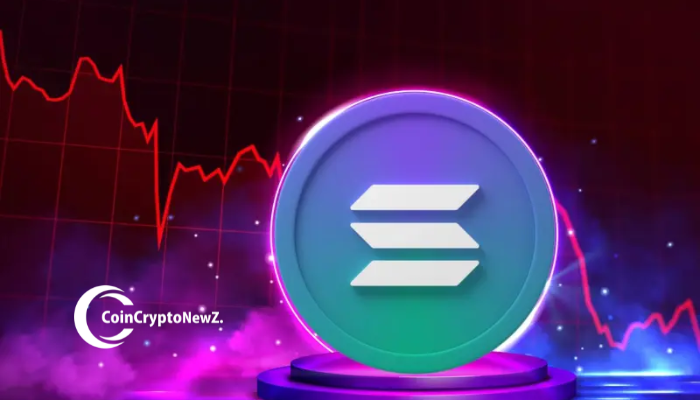
Key Technical Levels for Solana
- •Solana has lost the $120–$130 accumulation zone that had provided support for seven consecutive months.
- •The $70–$80 region, which represents the previous all-time high zone, is now the critical level for the bull case.
- •A failure to hold the $70 level would confirm a macro bear structure and could lead to targets of $30–$40.
Market Structure Shift and Distribution Signals
The current market data indicates a distribution phase for Solana. After successfully defending the $120–$130 range for over seven months, a period during which it served as a launchpad for every rally since March 2024, Solana has finally broken below this key level. The decisive close below $120 yesterday, accompanied by heavy trading volume, confirms growing concerns that the uptrend established in 2024–2025 is now facing significant jeopardy.
This situation transcends a typical dip that investors might consider buying. The $120 zone had been the most consistently respected accumulation range throughout the entire cycle, witnessing multiple retests, higher lows, and strong bounces whenever tested. The breach of this level on the weekly timeframe signifies a potential flip of the macro structure from bullish to bearish, a status that will persist until definitively proven otherwise.
Critical Support and On-Chain Indicators
The next significant area of demand is situated between $70 and $80, which corresponds to the previous all-time high zone from 2021 and the point from which the current multi-year breakout originated. Historical patterns demonstrate that assets which lose their multi-month base following an extended rally typically revisit their breakout levels. Should the $70 level fail to generate a strong reversal, the measured move from the broken rectangle pattern suggests a potential descent to the $30–$40 range, an area that represented the pre-pump consolidation in 2023.
On-chain data presents an equally concerning picture. The supply of SOL held on exchanges has surged by 18% over the last three weeks. Concurrently, the staking ratio is declining as holders unstake their assets with the intention of selling. Furthermore, the realized price for short-term holders has now surpassed the current spot price, which is a classic indicator of a capitulation event. The speculative fervor driven by meme coins, which propelled Solana from $18 to $294, is rapidly dissipating. Many individuals who were advocating for prices between $500 and $1,000 just weeks ago are now notably silent or have shifted to a bearish outlook.
The Decisive Period Ahead
In summary, the $70 mark represents the critical line in the sand for Solana's bull case. A robust weekly close above $100, supported by significant volume, could still preserve the bullish trajectory and maintain the integrity of the higher-timeframe trend. However, another downward movement without defense at the $70 level would serve as confirmation of a macro top and the official commencement of a bear market for SOL. The forthcoming two weeks are poised to be pivotal in determining whether 2025 will be characterized by a significant reset for Solana.