
Market Overview and Recent Performance
Solana (SOL) is currently holding the $135 support level following a 21 percent decline from its recent highs. This critical support zone has become the primary battleground for determining SOL's immediate trajectory, with the market still influenced by aggressive selling and shaken long positions.
The past week saw Solana begin on a bearish note, experiencing a significant selloff that reversed gains accumulated earlier in the quarter. After opening near $164 and briefly touching $171, SOL plunged 21% to a weekly low of $134. This price point converged with the strong $135–$126 support region, marking a crucial juncture for the cryptocurrency.
A Week Dominated by Sellers as Confidence Drops
Solana experienced sustained downward pressure throughout the past week, with performance metrics across all timeframes reflecting this trend. The token saw a 1% decrease over the last day, a 16% loss for the week, and is currently down 24% for the month, representing one of the sharpest pullbacks in recent months.
This sharp decline is mirrored in the volume chart, indicating a clear shift in market behavior. Throughout the week, Solana remained in a distribution phase, characterized by expanding red sell-volume bars during price drops and shrinking green buy-volume bars, signaling weak buyer conviction.
Data from CoinGlass highlights a significant liquidation event, with over $19 million in long positions being wiped out in the past 24 hours, contrasting with only $2.55 million in short liquidations. This indicates a pronounced long squeeze, where forced closures of long positions by exchanges accelerate the sell-off rather than allowing for natural stabilization.
The derivatives market has also shown signs of weakening sentiment. Open interest has fallen substantially from its peak of $17.10 billion in September to approximately $7.10 billion. This decline reflects a significant retreat in speculative activity, suggesting that many participants have either taken profits, reduced their exposure, or exited the market entirely. Historically, such steep drops in open interest often precede periods of price stagnation unless a strong catalyst emerges.
Technical Signals Flash Oversold: Mapping the Next Price Targets
Despite the prevailing bearish trend, several technical indicators suggest that SOL is entering oversold territory, a condition that frequently precedes short-term price bounces. The Relative Strength Index (RSI) reading is currently at 33, placing the token close to the oversold threshold.
Murrey Math signals further support this outlook, with the token positioned at the 1/8 and 2/8 oversold bands. Historically, these bands have served as launch points for short-lived recoveries, particularly when market pressure aligns with decisive volume spikes and a clearly defined support floor.
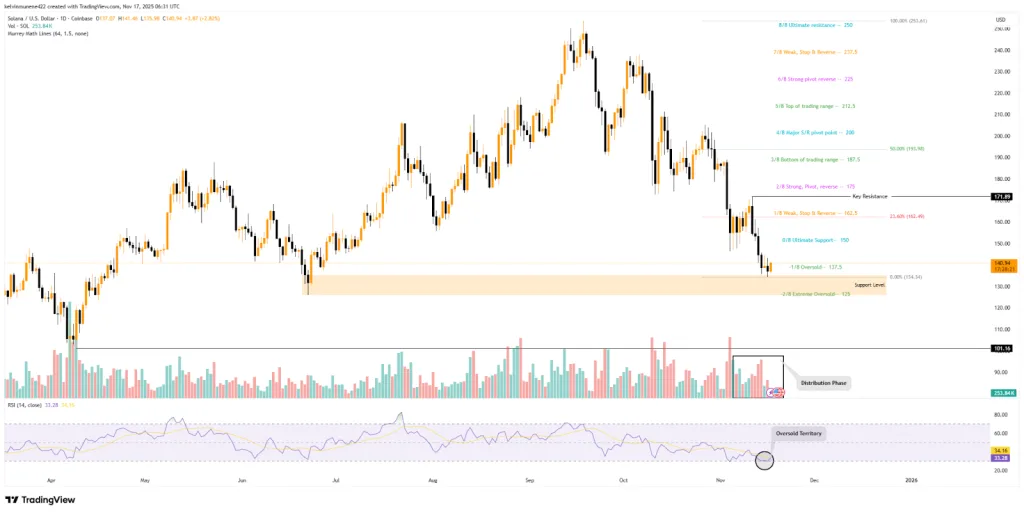
This confluence of factors lends significant weight to the $135–$126 support corridor, which stands as one of the most technically significant areas on the current chart. This zone has previously been instrumental in fueling strong upward movements and now represents the last notable cluster of buyer interest before deeper downside levels become a concern.
Key Levels To Watch
Should the current support level hold firm and trigger a rebound, SOL could first advance towards $150. This level would signify the early stages of renewed bullish momentum. A sustained push above this zone may clear the path towards $162, which aligns with the 23.60% Fibonacci retracement level. Such a move could potentially bring the token back into contact with last week's $171 resistance zone before the week concludes.
Conversely, if sellers manage to overwhelm this support band, the market could enter deeper territory. A breakdown below the $135–$126 range would expose the $120–$110 area, with the psychologically significant $100 level emerging as the next major downside target if momentum continues to erode.