

Solana faces resistance at $133 as traders assess whether upward momentum can continue in the near term. The support in the range of $124-$128 can support short-term market structure, provided that there is a pullback. Rising volume and steady intraday movement support a constructive trend during the week.
Solana trades near a crucial zone as market activity shows controlled movement and steady interest. The asset approaches a technical barrier that continues to limit upward progress, creating a refined setting for traders assessing near-term direction.
Resistance Pressure Near the Mid-Range Level
Solana encounters difficulty as the price approaches the 50% retracement area at $133. The asset struggles to break above this level, which keeps buyers cautious near the upper intraday range. This technical barrier has held across several tests, creating a pause in momentum.
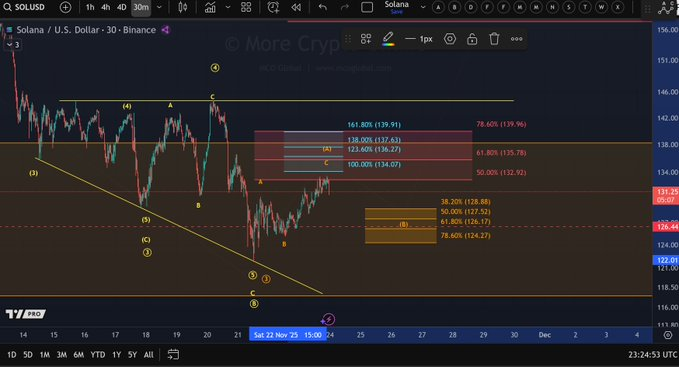
The recent Elliott Wave structure suggests that the market completed a corrective phase before advancing toward this resistance band. The chart shows a recovery from the 118–120 zone, where a well-defined pivot established the start of a potential impulsive sequence. This move pushed the price toward the cluster of Fibonacci levels around 134–138.
Market reaction near the 100% and 123.6% extensions signals compression as traders monitor rejection or continuation. The price structure maintains controlled moves rather than sharp swings, reflecting a measured climb during the last sessions. This mirrors the stable movement referenced in broader market commentary.
Support Zone Forms Below the Market
If a pullback develops, $124.27–$128.88 is identified as the next support area to track. This span is in line with the Fibonacci retracements of 38.2% and 78.6% of the recent swing. These levels form a structural cushion since markets fail the test and reassess.
The chart outlines orange and yellow support boxes that represent probable retracement targets for a wave (B) or wave 2 formation. Price defenses in these zones would maintain higher lows relative to the prior bottom near 118. Such behavior often preserves the early stages of an impulsive trend.
CoinMarketCap data shows SOL trading at $130.53, with a market cap of $72.98B and expanding 24-hour volume. Strong liquidity increases the chance that support zones attract buyer interest. The volume-to-market-cap ratio near 5.81% affirms broad activity during the session.
Momentum Holds as Buyers Test Conditions
The latest 24-hour chart indicates climbing intraday swings that reached peaks close to $134 before easing. The controlled rhythm of movement suggests traders are comfortable stepping into minor dips, maintaining structure above $129. Short-term patterns show a steady grind rather than volatile dislocation.
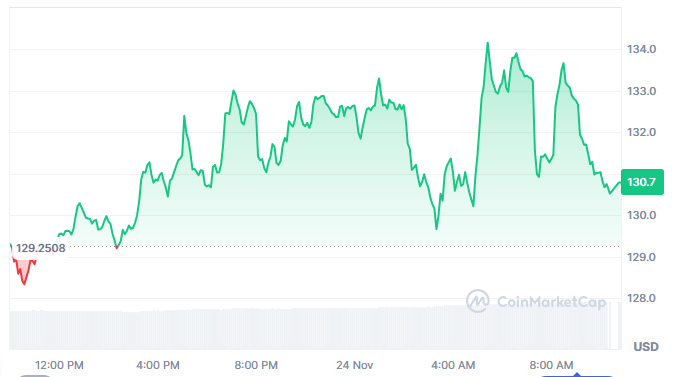
Market commentary notes that SOL demonstrates controlled momentum with steady movement. This observation matches the displayed price rhythm, showing measured progress without disorderly spikes or sharp declines. Consistent higher lows furnish a constructive backdrop.
If buyers maintain this pace, market focus will remain on whether SOL can eventually clear the $133 resistance. Until then, traders continue monitoring reactions across the established support and resistance zones as momentum unfolds.