

Key Insights
- •The important support level of Shiba Inu is at the price of $0.0000080, and it will be the marker of price direction.
- •The 4-hour chart shows an inverse head and shoulders so that as long as the support is maintained, the bullish argument is maintained.
- •Trading derivatives indicates that traders are holding back as they anticipate a break or a breakdown in the price of Shiba Inu.
The price of Shiba Inu has entered the stage of consolidation after trying to recover. The cryptocurrency has gained momentum, and it is currently drifting around well-established support and resistance levels. This lateral action implies the transition of the trading on momentum to a more orderly, structure-based trading period.
The volatility of the wider crypto market remains a factor of interest, and the stability of Bitcoin is under strong scrutiny. The price movement of the top cryptocurrency is also very important to measure the risk sentiment in the short term. With Shiba Inu trying to break a critical price point, the traders are looking at whether this support will be able to nourish the price and whether they will continue the recovery.
Inverse Head and Shoulders Pattern Signals Potential Upside
Looking at the 4-hour chart, Shiba Inu has created an inverse head and shoulders, a technical structure that is usually seen when the selling pressure decreases. The left shoulder of the pattern came out in December, and then the head was finished as a result of a fall in late December. Although there was an initial downward trend, the price soon recovered, indicating a change in market sentiment.
The right shoulder was formed in January as Shiba Inu returned to the position of $0.000008, making a prior resistance line its new support. The price action, even though there is resistance near the level of $0.0000090, respects the higher lows, and this indicates that the market is digesting the move and is not weak.
At $0.000008, Support is Crucial for Price Action
At this moment, Shiba Inu is trading close to $0.0000084, and the movement of its price honors the support level of $0.000008. The market is optimistic that another attempt at $0.0000090 can be made as long as this level is maintained. Breaking above this resistance can open the path to additional gains to a point of reaching $0.00001050 at the end of Q1.
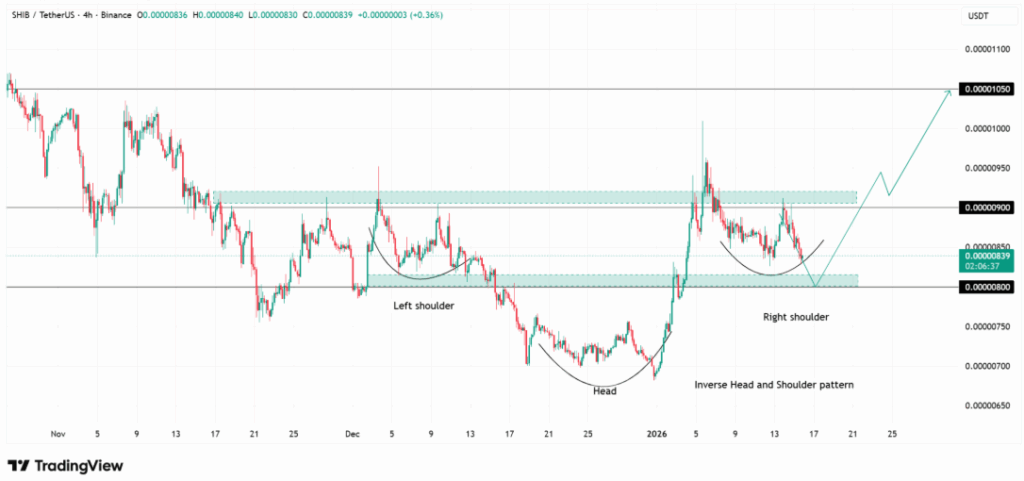
On the other hand, a loss of support at $0.0000080 would nullify the existing bullish formation, and the sellers would take control. Such a situation might cause the market to change to a defensive position and lead to a price recovery.
Derivatives Data Shows Trader Hesitation
The derivatives data of Shiba Inu indicates that traders are placing bets as opposed to investing. The trading volume has reduced to 40% at $192.87M, thus showing a more restrained nature as the price consolidates. Open interest has, however, slightly increased by 4.56, indicating that traders are just gearing up for an eventual movement as opposed to giving up altogether.
The market is characterized by long positions, and long-to-short ratios indicate a moderate bias to the bullish sentiment. This is backed up by data on liquidations; long positions have dominated most liquidations. The present price movement is thus a well-organized one, and the traders wait keenly for a breakout or a breakdown.