

Sei's native token, SEI, has returned to a price zone last observed seven months ago, following an extended four-month decline that has reduced its value by over 50%. This retreat occurs within a broader market downturn that has seen significant price drops across major cryptocurrencies, impacting the overall crypto market capitalization.
Despite the prevailing negative market sentiment, analysts are drawing attention to SEI's current price level, noting that it previously served as a catalyst for a substantial rebound. This has rekindled interest in whether this support level can withstand the current market pressures.
Technical analysis indicates that SEI has re-entered the $0.15–$0.13 price band this week. This is the same region that preceded an approximately 200% surge earlier in the year. As of the latest reporting, SEI has experienced an 11% decrease in the past 24 hours, reflecting the widespread anxiety affecting digital assets. The current market sentiment is characterized by severe risk aversion, as indicated by low readings on the Fear and Greed Index, leading to reduced trader confidence. This decline has positioned SEI at its lowest support zone since April.
From mid-July to November, the token has consistently recorded lower highs and lower lows, reinforcing a long-term downward trend that has characterized its market trajectory for nearly a year.
Analysts Identify Potential Reversal Zone
On-chain analyst Ali_charts has identified the $0.15–$0.13 range as a strategic area for accumulation, describing it as the "ideal" level for positioning. A shared chart illustrates a descending triangle pattern that has been forming for nearly two years, during which SEI has repeatedly failed to break above this pattern.
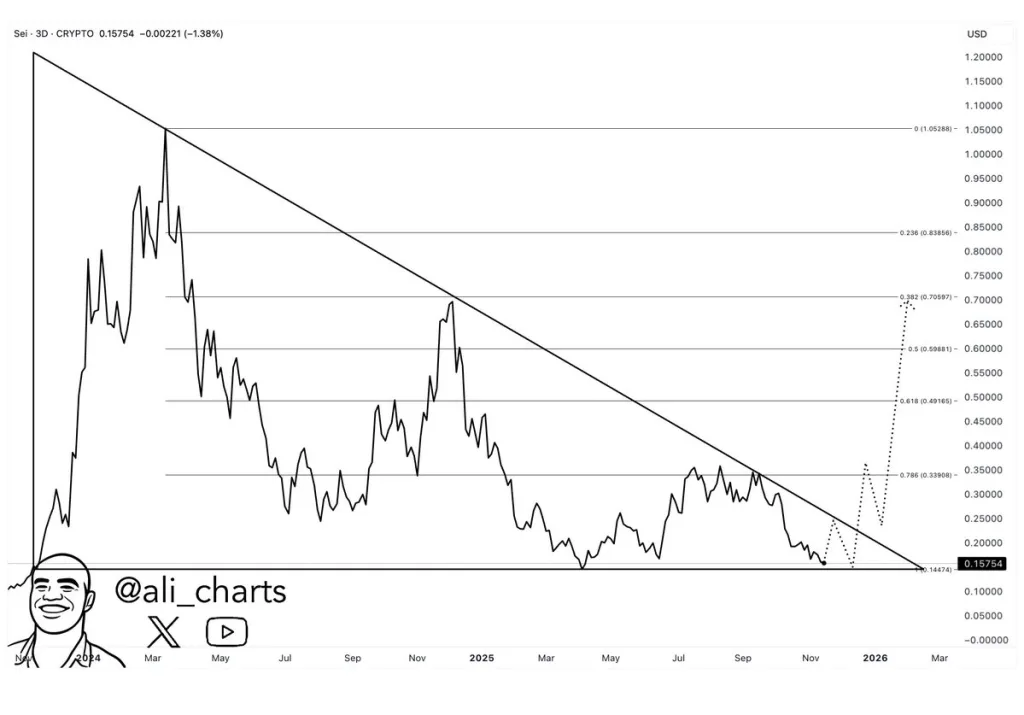
Ali's analysis outlines three potential upside targets based on Fibonacci retracement levels: the descending trendline of the triangle, projected to be around $0.25; the 0.786% Fibonacci level, around $0.33; and the 38.2% level from the November 2024 high, estimated at $0.70.
This projection suggests a potential increase of approximately 400% from the lower boundary of the current support band. Market analyst Michaël van de Poppe has also observed early signs of stabilization on the weekly chart.
Van de Poppe noted that initial trend reversals often begin slowly and pointed to the formation of a weekly candle along the upper side of the support region. This development follows a significant wick recorded in October, which represented the year's strongest downside test.
However, Van de Poppe also highlighted that the weekly 20-period moving average continues to trend downwards, indicating that overall momentum remains weak. Despite this, recent candles have flattened, suggesting a decrease in selling pressure.
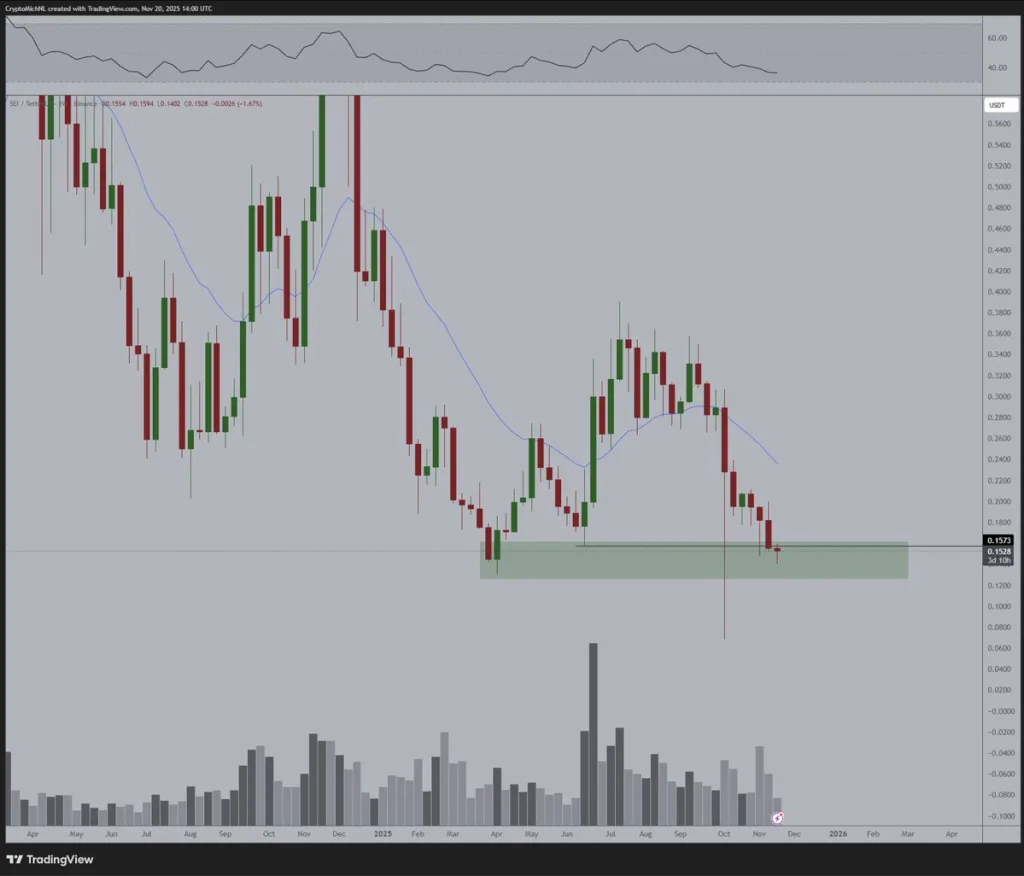
Trading volume has normalized since the heavy liquidation wave in October. The Relative Strength Index (RSI) is positioned just above the oversold area, indicating that the market is attempting to regain stability after an extended period of decline.
Regarding the current market setup, Van de Poppe anticipates that SEI could experience a "strong move" if the existing structure continues to develop favorably. He commented that the token has formed a "good weekly candle" but stressed the necessity of a "follow-up in the coming weeks" to confirm a genuine shift in momentum.
On-Chain Indicators Present Mixed Signals
Derivatives market data indicates a subdued activity. SEI's open interest has significantly decreased to approximately $82 million, down from a fourth-quarter high of $271 million. This contraction signifies reduced speculative trading and a decline in short-term trading conviction.
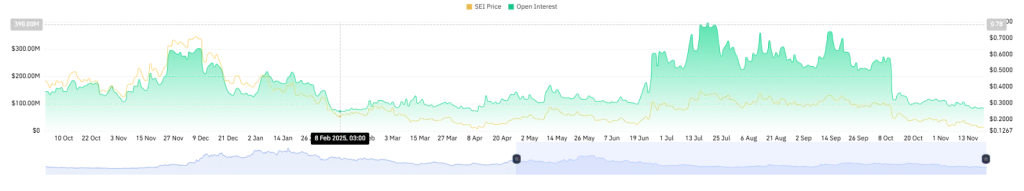
Similarly, trading volumes within derivatives markets are confined to a narrow range, suggesting limited volatility and restrained positioning by leveraged traders. The spot market, however, presents a different narrative. Exchange data reveals consistent outflows of SEI tokens beginning on November 11th. This trend indicates that holders are transferring their coins to private wallets rather than keeping them on trading platforms.
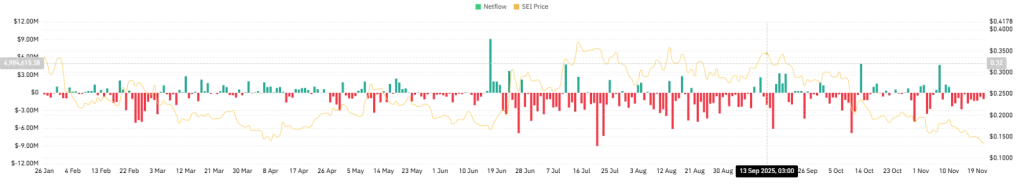
This behavior is often interpreted as accumulation, particularly when it occurs near critical support zones. This pattern suggests that long-term investors are maintaining confidence in the project, even in the face of short-term selling pressure.
Market Outlook Depends on Support Stability
SEI is currently positioned at a support range that has previously initiated a strong recovery. Analysts generally agree that the token's short-term prospects are contingent on the stability of this price level. While derivatives activity reflects caution, spot market data points to a steady movement of tokens into long-term storage, presenting a contrasting signal within a generally fearful market environment. The forthcoming trend for SEI will likely depend on the balance between these factors: whether the token can stabilize at its current familiar ground or if it will continue its decline amidst significant market uncertainty.