XRP continues to consolidate under key resistance levels after a volatile few months. Price action on both USDT and BTC pairs suggests that Ripple’s token is at a critical decision point. While sellers remain active, the downside appears limited unless broader market weakness resumes.
Technical Analysis
The USDT Pair
XRPUSDT is still trading inside the descending channel pattern marked on the daily chart. The asset has now reached the lower boundary of the wedge while also testing the key $2.10–$2.20 support zone. This region has acted as a demand earlier in recent months. Yet, a breakdown could prove to be devastating for investors, as it can rapidly drag the price down toward the $1.80 zone.
The overall trend also remains bearish under the 200-day and 100-day moving averages, with both converging around the $2.60 mark. So, for any sustained bullish recovery, XRP must first reclaim the $2.60 area and break above the key moving averages. Until then, the risk remains skewed to the downside.
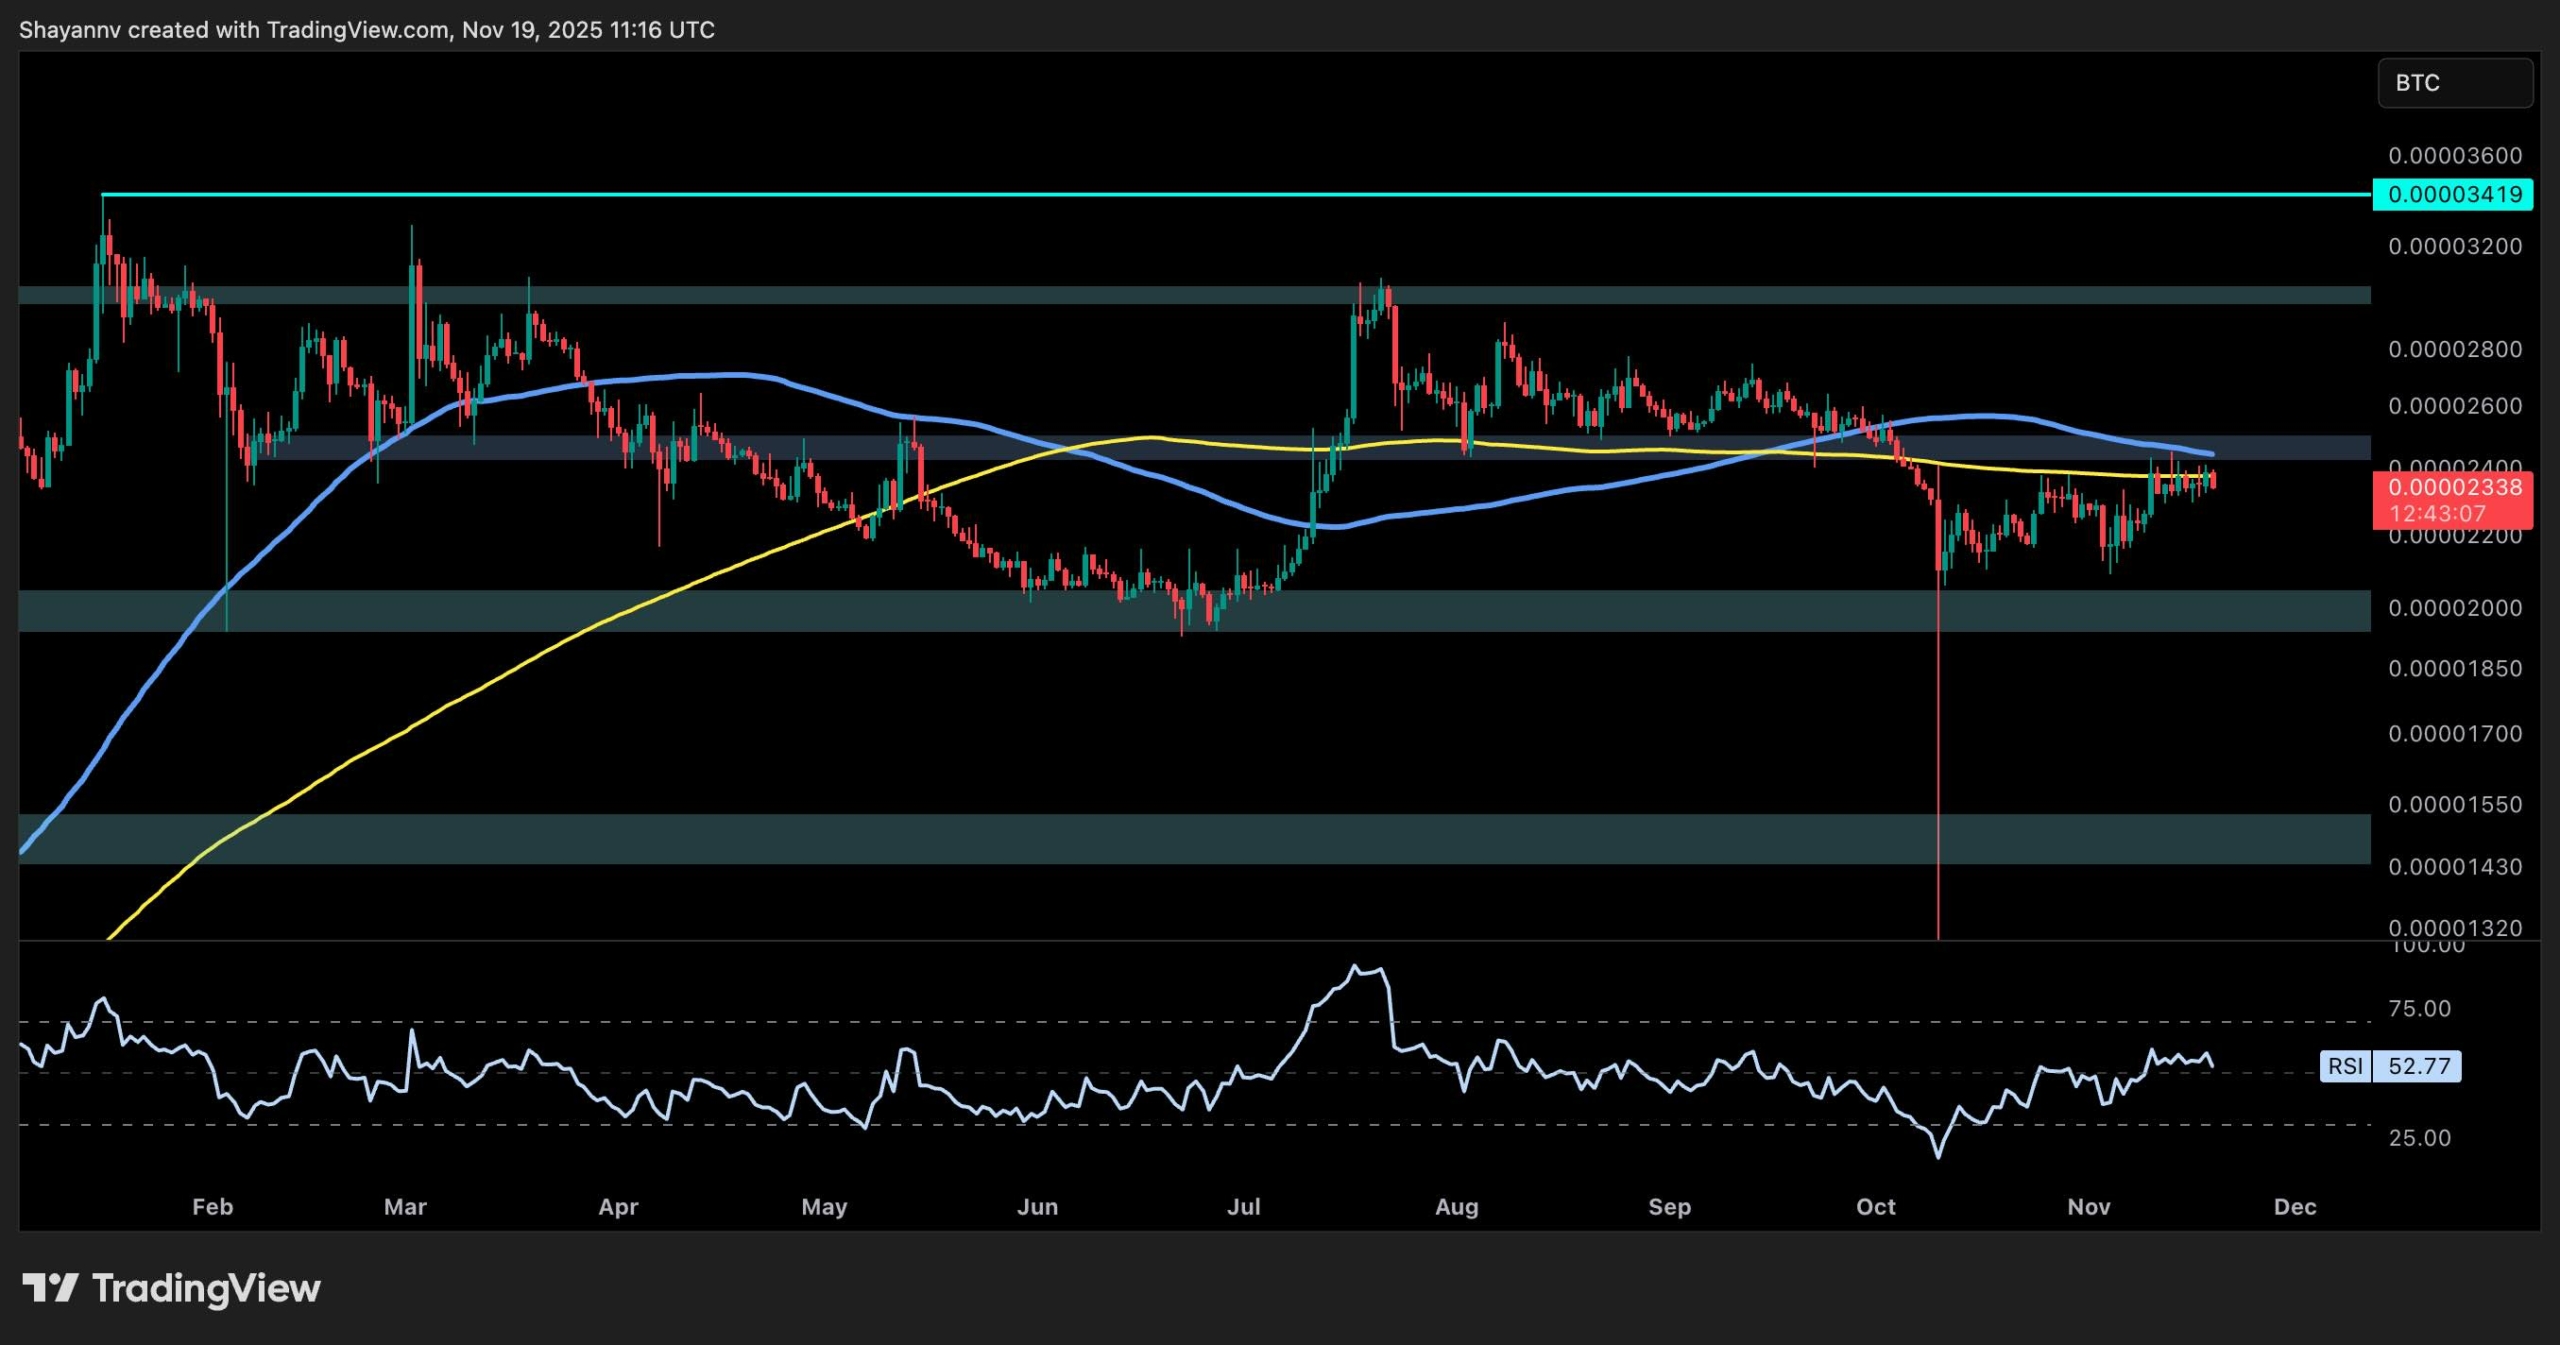
The BTC Pair
The XRPBTC pair is pushing into the key 2,400 SAT resistance zone, which also aligns with the 100-day and 200-day moving averages. So far, buyers have struggled to go past this area. Momentum also remains neutral, with RSI hovering around 52, and the price action suggests that a rejection is likely if BTC dominance picks up again.
If XRP manages to break and close above the 2,400 SAT supply zone, the next potential upside target sits near the 3,000 SAT mark. However, failure to break above the current area could lead to another visit to the 2,000 SAT support band in the coming weeks.