

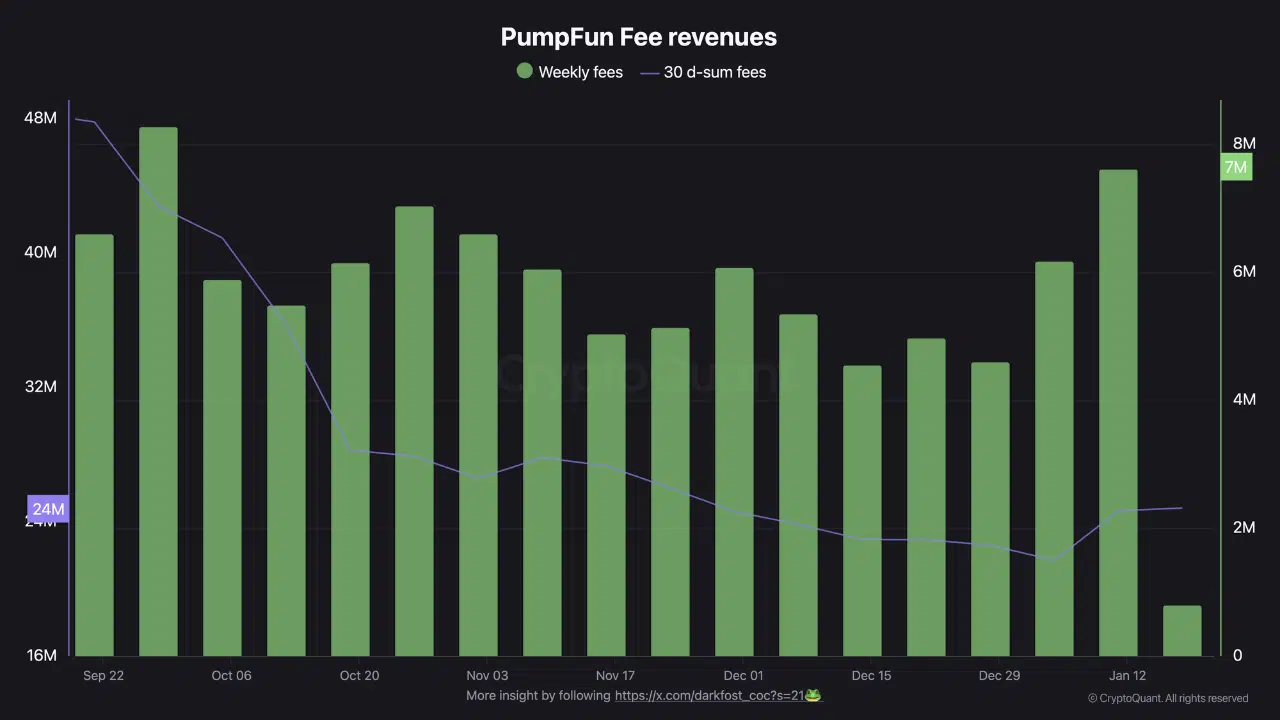
PumpFun's recent fee activity reflects a market moving through shifting participation rather than a single directional trend. The shared by CryptoQuant chart below tracks weekly fee generation alongside a rolling 30-day sum, offering a view into how user engagement and transaction intensity evolved over time. Together, these metrics highlight periods of contraction, stabilization, and a late rebound that reshaped short-term revenue dynamics.
Early Strength Followed by Gradual Compression
At the start of the observed period, weekly fees remain elevated, consistently printing above the mid-$30 million range and briefly approaching the upper $40 million area. At the same time, the 30-day cumulative fees begin at a relatively high level before entering a steady decline. This divergence suggests that while weekly activity stayed strong initially, aggregate momentum was already fading as earlier high-fee weeks rolled out of the calculation window.
Mid-Period Stabilization and Lower Throughput
As the timeline progresses into October and November, weekly fees compress into a tighter range, fluctuating mostly between the low-to-mid $30 million levels. According to CryptoQuant, the 30-day fee sum continues trending lower during this phase, indicating that new activity was insufficient to offset the loss of prior peak weeks. This period reflects a market operating with reduced throughput, where participation persists but without the intensity seen earlier.
Late-Period Reacceleration in Weekly Fees
Toward the end of the chart, weekly fees show a noticeable rebound, climbing back toward the higher end of the recent range and reaching approximately $7–8 million on the right-hand scale. This uptick occurs while the 30-day cumulative line begins to turn upward after a prolonged decline. The combination implies that newer weeks are contributing more meaningfully to total revenue, hinting at a short-term recovery in activity rather than a continuation of compression.
Revenue Structure Reflects Shifting Engagement
Overall, the chart illustrates a transition from high aggregate momentum to a flatter, lower-intensity phase, followed by early signs of renewed engagement. Weekly fees respond more quickly to changes in user behavior, while the 30-day sum captures the broader adjustment process. As shown, PumpFun’s fee structure appears sensitive to participation cycles, with recent data pointing toward stabilization after a period of sustained decline.