

Key Insights
- •The price explosion of Polkadot is supported by the Robinhood listing and was exposed to millions of retail traders.
- •The accumulation of whales and the increase in interest in the futures market are an indication of increased confidence in the future performance of Polkadot.
- •The fact that Polkadot broke out of a falling wedge pattern indicates that it has a good bullish trend, and the target is anticipated to be at $4.
Polkadot (DOT) experienced a significant price increase on January 14, gaining 10% following its listing on the well-known US-based crypto trading platform, Robinhood. This development marked a breakout from months of trading within a falling wedge pattern, suggesting potential for substantial momentum in the coming months. During midday trading, DOT reached a high of $2.32 before closing at $2.29, representing a 38% increase over its December price.
The Robinhood Listing Fuels a Price Boost
A primary driver behind Polkadot's price recovery was the increased exposure gained through its listing on Robinhood. As one of the most actively used trading platforms, Robinhood has now made DOT accessible to millions of retail traders, injecting fresh liquidity and expanding its market reach. This broader exposure is expected to drive further demand and provide a long-term boost for the token.
In addition to the Robinhood listing, renewed accumulation by crypto whales has also contributed to the price surge. Data from blockchain analytics firm Nansen indicates that large-scale investors have been increasing their holdings in DOT. Such whale activity typically signals growing confidence in the asset, potentially encouraging retail traders to follow suit. The involvement of influential investors lends further credibility to the bullish trend, persuading more traders to participate.
Futures Market Signals Growing Optimism
Beyond whale accumulation, the futures markets also reflect a noticeable shift towards optimism. Open interest in Polkadot futures contracts has surged by 15% over the past 24 hours, reaching $231 million. Furthermore, the funding rate for these contracts has turned positive, indicating that more traders are using leverage to bet on further price increases for Polkadot. These developments collectively suggest increasing confidence in DOT's short-term upside potential.
Technical Breakout Suggests Further Upside
On the daily chart, Polkadot has successfully broken out of a falling wedge pattern that had been in formation since October. This pattern is generally interpreted as a bullish trend reversal, implying that the token may be entering an upward trend. Based on the measured height of the wedge and its extrapolation from the breakout point, the Polkadot price could potentially target $4. The price has also breached a long-standing downward trendline, which further signals diminishing downward pressure.
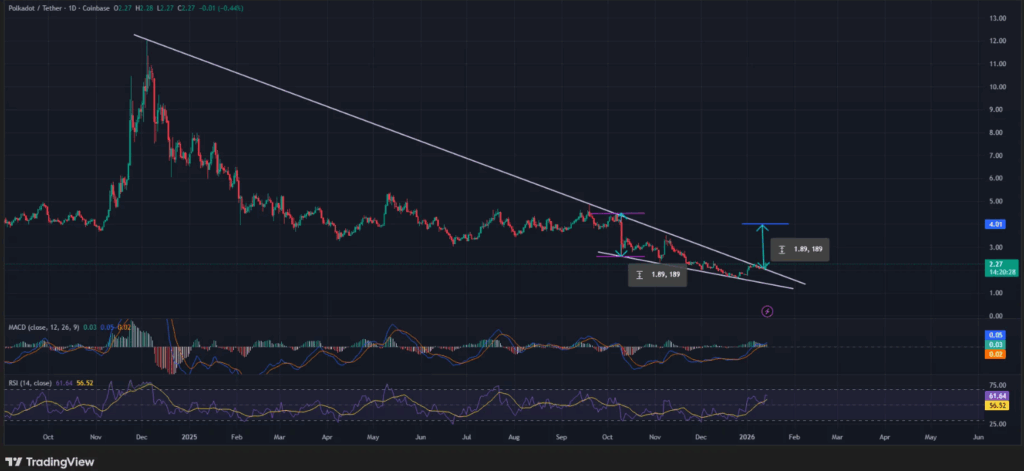
The positive outlook is further bolstered by technical indicators. The MACD lines are positioned above the zero line, indicating growing bullish momentum. Additionally, the Relative Strength Index (RSI) has formed a bullish divergence, a pattern often observed preceding significant price increases. Polkadot's recent performance, combined with these technical indicators, paints a promising future for the token as both retail and institutional investor interest continues to climb.