

PEPE's prominence in the cryptocurrency market has shifted, with a more cautious sentiment surrounding the meme coin. While some traders anticipate a significant turnaround in December, the current chart patterns suggest otherwise.
Analyst Ali Martinez has highlighted a critical development: PEPE has confirmed a head-and-shoulders pattern on its weekly chart. This classic bearish formation, according to Martinez's analysis, indicates a potential decline toward the $0.00000185 level, a price point not observed in several months.
The PEPE Chart Presents a Pattern of Concern for Traders
Ali Martinez's weekly chart analysis for PEPE depicts a bearish outlook, suggesting that the current downturn may be the beginning of a more prolonged decline. The chart shows PEPE struggling to maintain its position above the neckline of the head-and-shoulders pattern, with multiple weekly candles closing below it.
Martinez outlines two potential short-term scenarios: a minor relief bounce back towards the neckline region, or a period of consolidation just below it. Both scenarios imply that selling pressure remains dominant in the market.
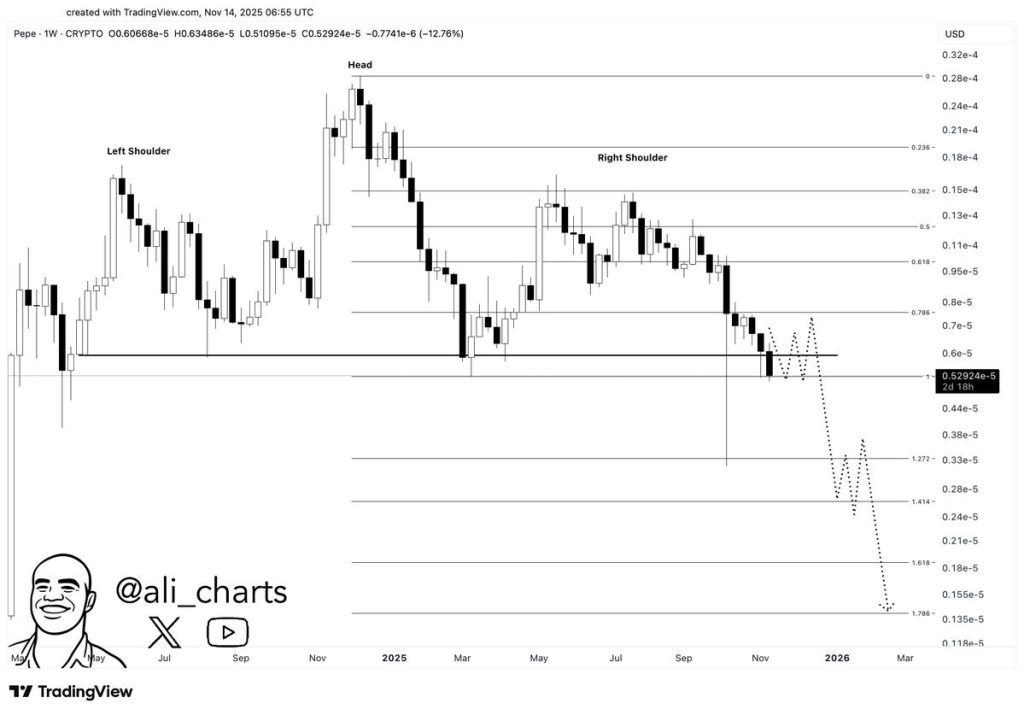
The more significant concerns lie in the potential for further price drops. Ali's analysis includes a series of Fibonacci extension targets. His projected path indicates PEPE could fall to approximately $0.0000044, then to $0.0000030, and potentially even lower to levels around $0.0000021 and $0.0000015. The most extreme target is near $0.0000011, aligning with the 1.786 Fibonacci extension, a level often reached during significant market capitulations.
In summary, Ali's chart frames the current price action not as a mere correction, but as a confirmed breakdown from a significant multi-month trading structure. Unless the neckline is reclaimed swiftly, his analysis suggests that PEPE could be entering its most challenging phase to date.
Momentum Continues to Indicate a Downward Trend
The recent weekly candle closes for PEPE make it difficult to argue for bullish control. The cryptocurrency has experienced a gradual decline over several weeks, with any attempted bounces being quickly rejected.
The dashed line on Ali's chart suggests that PEPE's price might continue to trade sideways for a period before experiencing another downward movement once selling pressure intensifies.
A primary issue currently is the lack of trading volume. Breakouts in meme coins typically require substantial buyer participation to be sustained, which is currently absent. Without this level of engagement, rallies tend to be short-lived, and the price chart continues to drift lower.
Can the PEPE Price Reach a New All-Time High?
The current PEPE price is situated in a precarious position on the chart, with the risk of further declines appearing greater than the possibility of a sudden breakout.
While December historically brings volatility to the cryptocurrency market, this volatility may lean towards the downside unless significant changes occur in the chart patterns.
At present, analysts are paying closer attention to the $0.00000185 level than to any potential new highs. PEPE requires a substantial shift in market momentum before a bullish narrative can realistically be considered.