

- •PEPE trades near a historical Fibonacci support zone, suggesting potential accumulation before the next major price move.
- •Market capitalization holds at $3.82B with strong liquidity, reflecting sustained interest despite short-term corrective movement.
- •RSI rebound and cyclical price behavior indicate possible preparation for upward continuation in the coming sessions.
PEPE is consolidating after recent volatility, with technical signals suggesting the meme coin could be preparing for its next directional move. Market participants remain watchful as the asset hovers near a historically important support region.
Cyclical Patterns and Fibonacci Support
Chandler (@ChandlerCharts) shared a chart suggesting PEPE may be preparing for a strong breakout. The visual analysis displays clear multi-year market cycles where each bullish leg followed a retracement into Fibonacci support levels before rallying higher.
The current price action mirrors those past patterns. PEPE is oscillating around the $0.236-$0.382 Fibonacci range between $0.000000092 and $0.00000012. This area has served as a launchpad to rallies in previous cycles, typically the point of transition between accumulation and expansion.
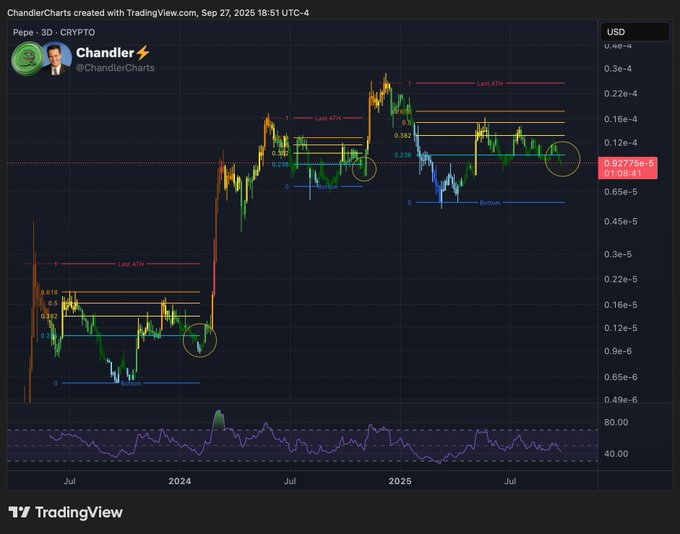
Historical structures indicate that retracement into these levels often precedes momentum surges. If buyers maintain support in this zone, the setup suggests that PEPE could be preparing for a push toward higher resistance points and potentially retesting all‑time highs.
Current Market Performance
At the time of writing, PEPE is priced at $0.0000009106, showing a 1.8% decline over 24 hours. The asset reached a session high of $0.0000009354 before facing selling pressure, which pulled it back below the $0.00000093 resistance.
Despite the pullback, PEPE’s market capitalization remains stable at $3.82 billion, with supply fully in circulation at 420.69 trillion tokens. This alignment between circulating and total supply removes dilution risk, offering stability in the medium term.
It is a stable interest as indicated by the 24‑hour trading volume of $236.1 million. Although lower than past levels, this volume signals good liquidity and active trader involvement—vital for sustaining depth during both consolidation and breakout phases.
Resistance Levels and Momentum Indicators
The graph indicates resistance at about $0.00000016, and at the last all‑time high of $0.00000030. A strong action above $0.00000012 with volume would probably turn the tide to a bullish attitude, opening the door to these targets.
On the other hand, failure to accumulate beyond $0.00000090 might have PEPE re‑test the more profound $0.000000065‑$0.00000007 accumulation region. This range has repeatedly served as a foundation during long cooling intervals, providing support on which to build fresh rallies.
There is also an indication of a possible shift in momentum indicators. The RSI seems to be returning to oversold levels, indicating declining selling pressure and potential new purchasing impetus. This technical revival, when sustained, may align with the traditional cycle that has led to past expansions.