

Key Insights
- •PENGU has successfully reclaimed the critical $0.01 support level, establishing a more robust base after a period of significant selling pressure.
- •A weekly TD Sequential buy setup suggests that early momentum could return if key resistance levels are breached in the near future.
- •Daily indicators are showing an improving market structure, with the Relative Strength Index (RSI) trending upwards and the Moving Average Convergence Divergence (MACD) shifting higher from recent lows.
PENGU has moved back above the $0.01 mark after experiencing a dip below this level in the previous week. The re-establishment of this price point has created a distinct support floor on the 4-hour chart. Analyst Aleksander.TraderX observed that the token “reclaimed the KEY zone at 0.01,” and expressed an expectation for firm support to be maintained within this range.
This recovery occurred following a bounce near the monthly resistance level at $0.010154, where buying interest emerged and propelled the market upwards. This price action has repositioned PENGU within a zone that previously influenced trading activity and served as a base during earlier market swings.
PENGU reclaimed the KEY zone at 0.01. I expect support to remain firm in that range.
Aleksander.TraderX
Subsequently, the price advanced towards the $0.0116 level on the 4-hour chart. Candles observed around this area indicate a degree of indecision, characterized by wicks on both ends of the price range. TraderX posed the question of whether this area represents “a bearish underside retest or a new push to the upside,” prompting traders to assess the strength of the upward move. A decisive close above $0.0116 could pave the way for further price appreciation towards the next significant daily resistance level.
Weekly TD Signal Points to Early Strength
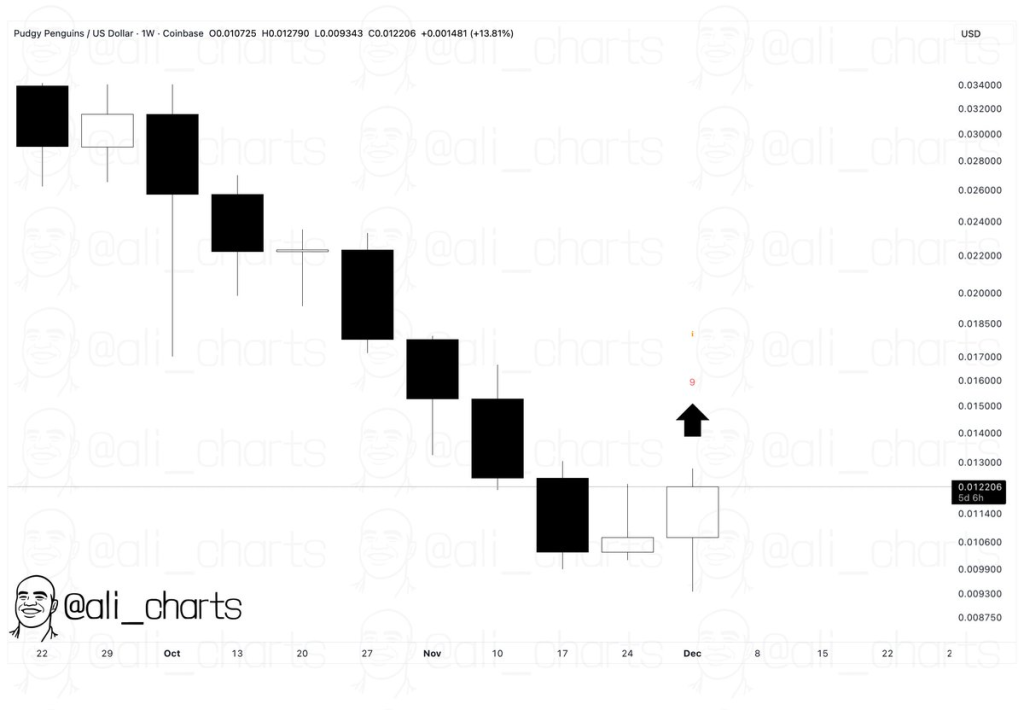
The weekly chart for PENGU indicates a deceleration in its prolonged downtrend, which began in October and November. The token had registered a consistent series of lower lows before finding support near the $0.009 mark, where buyers responded to the recent market weakness.
Analyst Ali shared that the TD Sequential indicator has generated a weekly buy signal, suggesting that “the bottom could be in.” This signal emerged after nine consecutive weeks of downward pressure, often marking a turning point where markets tend to stabilize.
PENGU has now traded above $0.011, with two recent weekly candles exhibiting improved chart structure. The most recent weekly candle demonstrated a clear rebound from the prior week's low, contributing to a more defined base formation on the chart. The price range between $0.013 and $0.014 is now identified as the next key area to monitor on higher timeframes.
Daily Indicators Show a Gradual Shift
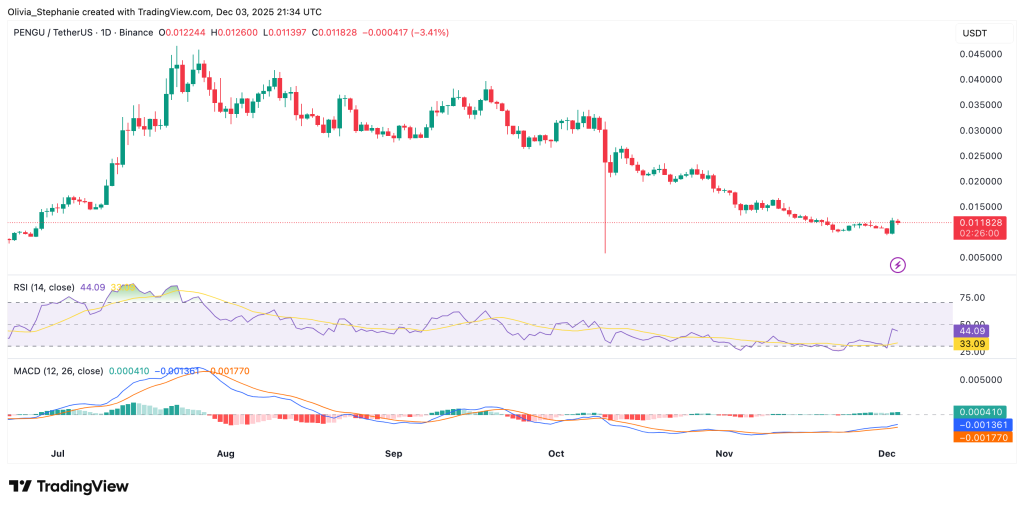
PENGU is currently trading around $0.01183, showing a seven-day gain of 3.9% and a 24-hour change of -1.6%. The market is exhibiting early indications of stabilization, with the price holding above its recent support levels.
The Relative Strength Index (RSI) is positioned at 44, moving away from oversold territory and signaling a reduction in selling pressure. Concurrently, the MACD has shown an upward trend, with its histogram turning slightly positive and both MACD lines beginning to converge.
Key Levels Guide the Next Move
Should PENGU maintain its position above $0.01 and successfully break through the $0.0116 resistance level, the focus will then shift to the daily support level situated at $0.012869. A strong, sustained close above this zone would serve as confirmation of improving market momentum as the chart continues its stabilization process.