

Key Insights
- •PENGU is forming an inverse head-and-shoulders pattern, suggesting a possible trend reversal above the $0.0138 level.
- •The price has found support at the 0.382 Fibonacci level, with recent upward movement backed by strong trading volume.
- •A breakout above $0.0138 could lead PENGU towards the $0.0204 target, with $0.0226 considered a more ambitious goal.
Inverse Head-and-Shoulders Pattern Formation
On the 12-hour chart, PENGU exhibits a clear inverse head-and-shoulders structure. This technical pattern is characterized by three significant points: a left shoulder, a lower head, and a right shoulder with a higher low. The neckline of this pattern is established at $0.0138, which is currently acting as a critical resistance level.
According to chart analysis from Ali charts, the $0.0138 level is identified as the trigger point for a potential upward move. A confirmed price close above this mark could propel PENGU towards the next target of $0.0204. An even higher level at $0.0226 is also being closely monitored. Current price action indicates buyers are exerting pressure as the asset approaches this resistance zone.
PENGU Breakout Watch: $0.0138 Breach Could Trigger $0.0204 Run
Should the price fail to breach the $0.0138 resistance, immediate short-term support is located at $0.0131. Further down, the levels to watch are $0.0114 and $0.0084. A decline below $0.0114 would indicate a weakening of the current bullish structure.
Fibonacci Level Support Holds Strong
Examining short-term movements on the 4-hour chart, analysis from AltcoinSherpa reveals that PENGU found significant support at the 0.382 Fibonacci retracement level, approximately $0.01179, after reaching a high near $0.0138 earlier in January. This level has since served as a stable base, with price action consolidating sideways for several days.
The price is now trending back upwards towards the upper range of this consolidation. A notable increase in trading volume suggests renewed investor interest. A projected path on the chart indicates the possibility of a brief dip before another attempt to move higher. Sherpa observed, "Wouldn’t be surprised to see a pullback at the highs though," referring to the $0.0138 resistance zone.
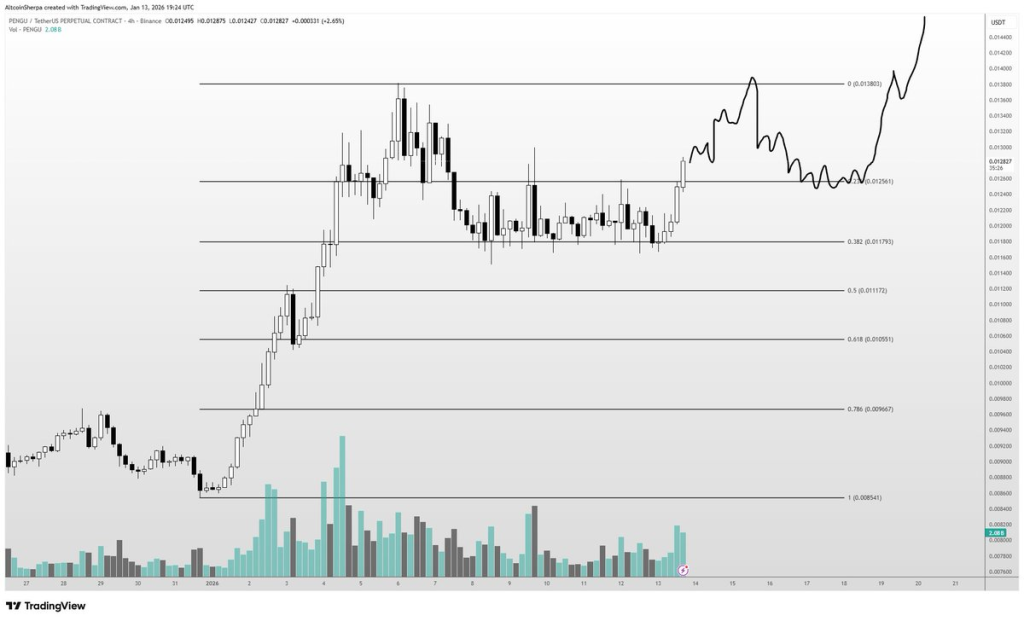
The current chart also suggests that short-term volatility remains a possibility as the market determines its next direction.
Market Statistics and Current Levels
PENGU is currently trading at $0.01329. The asset has seen a 5.63% increase over the last 24 hours and a 7.09% rise in the past week. Trading volume is reported at $385 million, reflecting heightened activity as the price approaches the critical $0.0138 level.
As is common with most digital assets, broader market movements, particularly those of Bitcoin, continue to exert significant influence. Sherpa commented on this dynamic, stating, "Of course everything will go as Bitcoin goes," highlighting Bitcoin's impact on altcoin performance.
Monitoring the Breakout Zone
The $0.0138 level remains the primary focus for traders and analysts. A confirmed breakout above this resistance could potentially drive PENGU's price towards the $0.0204 mark. Until a decisive breakout occurs, price action around this key range is expected to remain dynamic.