

Stablecoin supply continues to rise despite Bitcoin's recent correction. This trend suggests that capital remains within the system rather than exiting, indicating caution rather than a confirmed bear cycle. The mint and burn activity, rather than trading volume, determines real inflows or outflows, making stablecoin supply one of the clearest macro liquidity indicators. The current market structure resembles a pause or positioning phase, not a liquidity-driven collapse, but confirmation requires observing the U.S. Dollar Index (DXY), ETF flows, and policy signals.
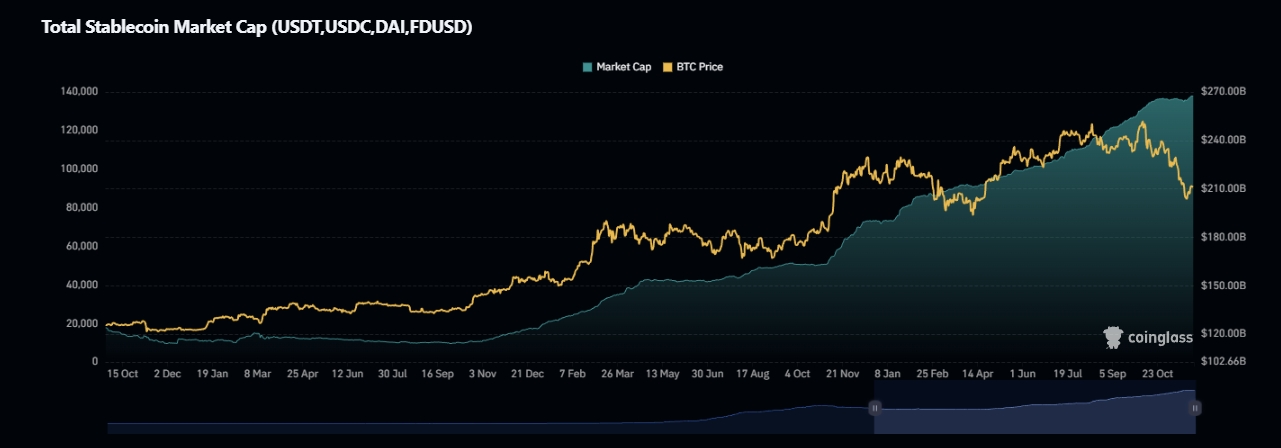
Over the past few weeks, Bitcoin has experienced a sharp pullback, falling from the $120,000 region down to the $80,000 range at its lowest point. Naturally, market sentiment shifted. Social feeds flipped from euphoria to fear, and timelines changed from predictions of "$200K inevitable" to questions of "Is this the top?" However, while price action was breaking structure and headlines were amplifying panic, one signal remained surprisingly stable, even quietly rising: the total market capitalization of major stablecoins did not collapse. Instead, it continued to climb and currently sits around $267.49 billion. This detail significantly alters the interpretation of the recent correction, suggesting that the move may not reflect a full trend reversal, but rather a rotation, a pause, and not an exit or a bear market. This distinction is crucial.
Why Stablecoins Matter
Stablecoins are often overlooked as a mundane part of crypto, simply considered "digital cash." However, they function as the monetary base of the crypto economy. Whether for retail traders swapping tokens on-chain or institutions preparing to scale their exposure, very few individuals or entities purchase Bitcoin, Ethereum, or altcoins directly with fiat currency. The initial step almost universally involves converting real-world currency into stablecoins, primarily USDT or USDC. Stablecoins represent the on-chain equivalent of liquidity, foreign reserve capital, and dry powder. Therefore, when the total circulating supply of stablecoins increases, it typically signifies that fresh capital has entered the crypto system. Conversely, a decrease signals that capital is not merely taking profits but is leaving the ecosystem entirely. This is because, unlike Bitcoin or altcoins where supply never disappears, stablecoins can be both minted and burned, a mechanism that is key to understanding market dynamics.
The Flow Behind the Supply Numbers
To grasp why stablecoin supply serves as a reliable macro indicator, it's essential to understand the issuance process, particularly for USDT. The process is straightforward yet strict: an institution wires dollars to Tether's banking partner, Tether confirms receipt, and then USDT is minted and released into circulation. Minting occurs only after the dollar is secured in their system, meaning supply growth is reactive to capital inflow, not anticipatory. Similarly, the reverse process applies: if an institution wishes to exit, they redeem USDT, the issuer returns fiat, and the tokens are burned, permanently reducing liquidity from the crypto economy. A critical nuance that many overlook is that buying or selling Bitcoin using USDT does not alter the total stablecoin supply; it only changes ownership. Consequently, the only moments that significantly impact supply are minting, which represents real-world money entering the crypto system, and burning, which signifies money leaving the system back into fiat rails. All other activities, such as trading, arbitrage, swapping, or hedging, constitute internal movement. This is precisely what makes the stablecoin chart a macro pulse rather than a price chart.
- •If an institution wants to exit, they redeem USDT.
- •The issuer returns fiat and burns the tokens.
- •The supply decreases, permanently removing liquidity from the crypto economy.
And here's the nuance most people miss: buying or selling BTC using USDT does not change total stablecoin supply. It only changes ownership. So the only moments that matter for supply are: minting — real-world money entering the crypto system, and burning — money leaving the system back into fiat rails. Everything else — trading, arbitrage, swapping, hedging — is internal movement. That's what makes the stablecoin chart a macro pulse, not a price chart.
How to Read This Signal
Once the underlying mechanics are understood, stablecoin movements become a valuable cycle indicator. Broadly, the market can be categorized into four possible states:
1 — Supply Up + BTC Up → Expansion Phase
This represents the clearest form of a healthy bull leg. Fresh capital flows into the market, stablecoin supply climbs, and increased demand pushes Bitcoin higher. This phase is characterized by strong inflows, higher exchange balances, and organic interest rather than solely leverage. This pattern is clearly visible in the early expansion phases of every bull cycle.
- •Strong inflows
- •Higher exchange balances
- •Organic interest rather than just leverage
2 — Supply Up + BTC Down → Accumulation or Waiting Phase
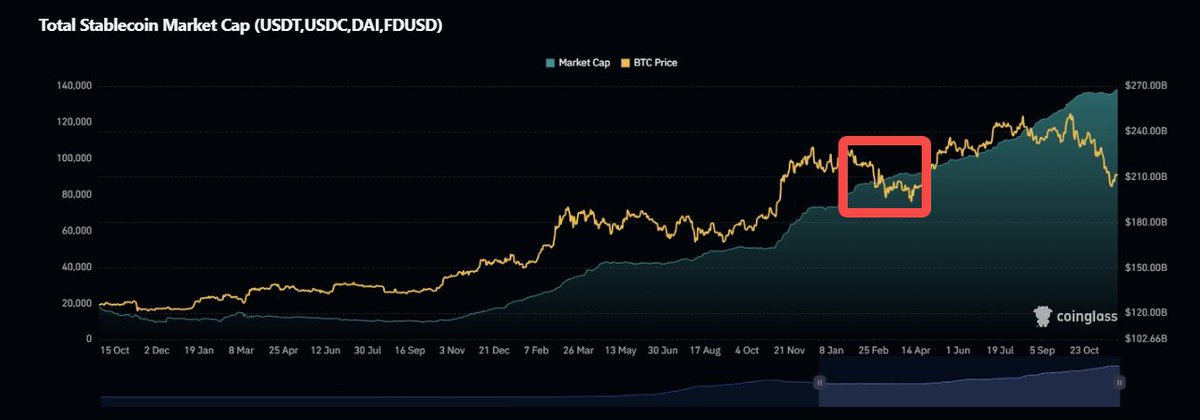
This is where the market dynamics become particularly interesting, and it appears to be where the market is currently situated. Even though the price corrected, stablecoin supply continued to rise. This typically indicates that money has not exited the system but is waiting. Institutions are not capitulating but are repositioning themselves. Liquidity is not drying up but is sitting on the sidelines. Historically, this phase precedes major continuation moves, especially when macro catalysts such as rate cuts, ETF flows, or a weakening U.S. Dollar Index (DXY) are still pending. In previous cycles, this phase has lasted for weeks to months, acting as a period of silent energy coiling.
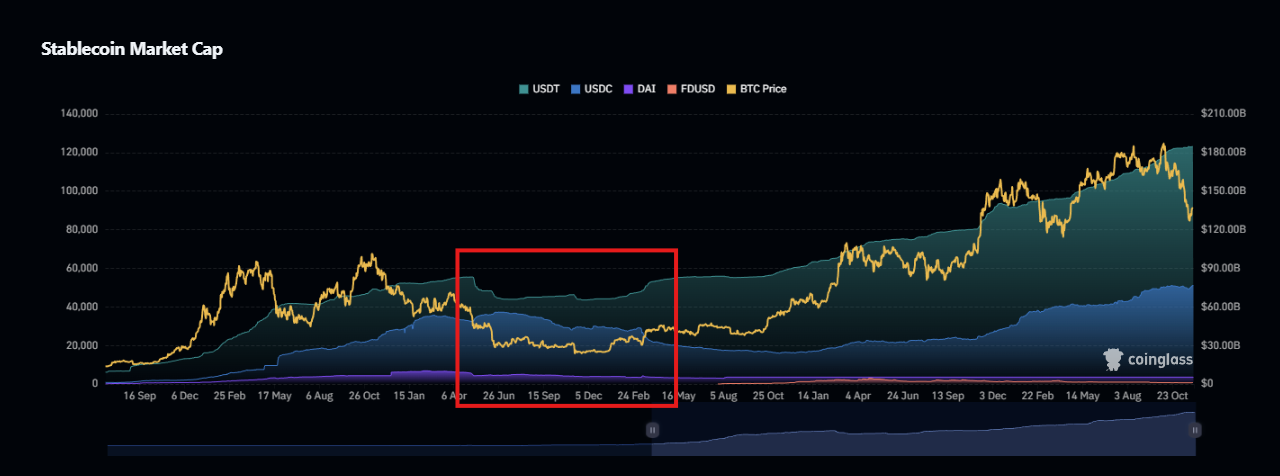
3 — Supply Down + BTC Down → True Bear Market
This scenario represents the textbook definition of a crypto winter. Bitcoin drops, confidence collapses, investors redeem stablecoins back into cash, and supply contracts for months, sometimes years. This occurred after late 2021 and continued into early 2023. That period was not just "volatility"; it was a capital evacuation.
4 — Supply Down + BTC Up → Late-Cycle Warning
This pattern is rare and often considered dangerous. It suggests that price is rising not due to new capital entering the system but because speculation is overheating, leverage is accelerating, and the same limited liquidity is being recycled aggressively. Markets running on such limited resources eventually stall, sometimes slowly and sometimes violently.
So Where Are We Now?
Given that stablecoin supply is still rising, no significant burn events have been recorded, liquidity has not meaningfully left the system, and Bitcoin's drop has not triggered a liquidity exodus, the current market structure is far closer to Phase 2: The Waiting / Positioning Stage, rather than Phase 3. In other words, this does not resemble a genuine bear market; it looks like a pause. The distinction between a pause and a reversal is what separates early accumulation from panic selling.
What Comes Next?
Stablecoin supply alone cannot predict timing but can indicate market conditions. To confirm the direction from this point forward, other signals worth monitoring include the U.S. Dollar Index (DXY), ETF inflows and outflows, and Federal Reserve rate decisions and policy tone. If these factors align with the current stablecoin trend, this drawdown may be remembered like many before it: a shakeout before continuation, rather than the beginning of a winter.
Final Takeaway
Crypto markets do not move solely because charts appear bullish. They move when money enters, stays, or exits the system. Currently, despite volatility, fear, and price drawdowns, the money has not left; it is waiting. As long as liquidity remains within the system, a market cycle is not dead; it is loading potential.