

Technical Analysis of XRP's Recent Price Action
XRP began the week with a significant technical reaction at a crucial level on its chart. Analyst CasiTrades observed that XRP experienced a precise drop directly into the macro 0.5 Fibonacci support at $2.04 over the weekend, and this level held firm. This is the same support zone that has been closely monitored for weeks, and the immediate buyer interest at this area lends credibility to the broader market structure being outlined.
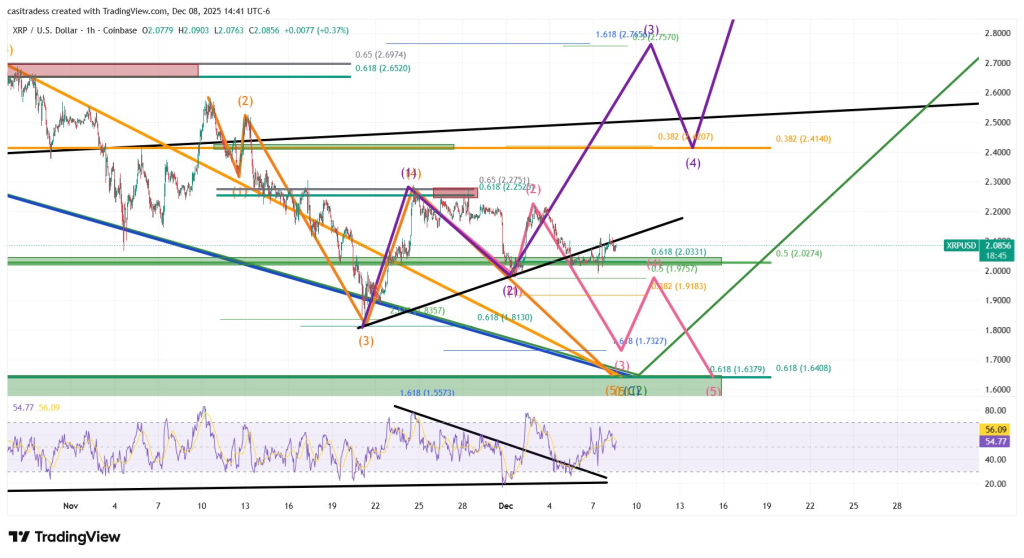
The price chart illustrates the asset tapping the green support region before initiating a bounce, which aligns perfectly with earlier projections. This movement currently keeps XRP within its established bullish framework, although definitive confirmation is still pending. As CasiTrades pointed out, this level represents a critical decision point rather than a confirmation of bullish momentum.
Key Resistance Levels for XRP
While the successful defense of the $2.04 support level is encouraging, XRP must overcome higher resistance zones to truly shift momentum in a bullish direction. The chart identifies two primary resistance areas overhead:
- •$2.41 – the initial significant resistance level.
- •$2.65 – the level that would confirm a breakout.
As long as XRP remains below the $2.41 resistance, the bullish structure continues to be unconfirmed. A decisive break above this area, followed by a push towards the $2.65 Fibonacci extension, is necessary to validate the bullish trajectory depicted on CasiTrades’ chart. Only then would the scenario suggesting a move towards the $2.75 region begin to materialize.
The Relative Strength Index (RSI) indicator provides additional context. While the RSI has broken its prior downtrend, it has not yet entered a strong momentum zone. This observation aligns with the current state of XRP, which appears to be stabilizing rather than trending decisively.
Potential Bearish Scenario for XRP
CasiTrades has cautioned that if the XRP price fails to hold the $2.04 support level, the bearish scenario becomes immediately viable. The chart outlines a clear potential downside sequence with specific targets:
- •First target: $1.73, which corresponds to the .618 local support.
- •Deeper target: $1.64, representing the .618 macro support.
This bearish scenario, visualized as a pink path on the chart, suggests XRP could break down from its current rising structure and retest the deeper macro support zone. This area, situated between $1.64 and $1.73, has historically served as a significant demand zone and would likely become the next logical bounce region should the $2.04 support fail.
The Significance of the $2.04 Support Level
CasiTrades highlighted a fundamental trading principle: entering positions at key Fibonacci support levels offers traders an advantageous entry point, irrespective of the eventual market direction. Buying at a major retracement point provides:
- •A strong upward positioning opportunity if the bullish scenario plays out.
- •A clear invalidation level just below the support if the bearish scenario materializes.
Essentially, disciplined entries around the $2.04 level enable traders to prepare for potential outcomes rather than reacting emotionally after a price move has already occurred.
XRP is currently positioned between two influential levels: the defended support at $2.04 and the unbroken resistance at $2.41. Until one of these levels is decisively breached, both the bullish and bearish structures remain fully valid. CasiTrades’ chart effectively illustrates that XRP is at a critical technical juncture.
For the present moment, the market has shown respect for the initial key support level. XRP's next move, whether upward or downward, will likely dictate the trend for the remainder of December.