
Solana (SOL) has reclaimed a key technical level that could determine its next significant price movement. As of the latest data, SOL is trading around $142, reflecting a 4% increase over the past 24 hours. However, its performance over the last week shows a slight decrease of nearly 1%.
$130: The Crucial Pivot Level for Direction
According to analyst Crypto Patel, SOL has successfully bounced from the $130 support level. This rebound aligns with both a horizontal support zone and a long-term rising trendline observed on the weekly chart. Historically, these areas have proven to be strong turning points for the cryptocurrency.
$SOL reclaimed the $130 support with a clean bounce.
Sustained acceptance above $130 reactivates the $250 upside target. Failure to hold converts structure bearish, opening downside toward the 0.382 Fib retrace at $75 and the 0.5 Fib level at $50.
$130 remains the critical pivot level for direction.
— Crypto Patel (@CryptoPatel) November 26, 2025
Sustained trading above the $130 mark could help maintain upward momentum, potentially bringing targets near $250 and $293 into focus. Both of these levels have acted as significant resistance points in previous market cycles.
Conversely, if SOL fails to hold above $130 and closes below this level, the market structure could shift to bearish. Such a scenario might lead to a downward trend, with potential targets at $74 and $50, which are identified as key Fibonacci retracement levels and areas of prior price interest.
Furthermore, analyst CryptoCurb has identified what appears to be a large Cup and Handle pattern on SOL's long-term chart. The "cup" portion of this pattern encompasses the price movement from SOL's peak in 2021 down to its low in 2023 and subsequent recovery. The current period of range-bound trading is forming the "handle" of this pattern.
For this pattern to materialize as predicted, a sustained move above the $250–$300 range would be necessary. Holding this higher level would establish a new key resistance area and could potentially trigger a significant upward move, possibly towards $2,000 if the price continues its ascent.
On-Chain Data Reflects Market Stress
On-chain analyst Ali Martinez has highlighted recent data indicating that SOL has entered the capitulation zone on the Net Unrealized Profit/Loss (NUPL) indicator. This suggests that a majority of current holders are experiencing unrealized losses.
Historical data shows that previous instances of SOL entering this zone in 2022 coincided with longer-term price bottoms.
“Solana usually bottoms when investors capitulate—and that’s what we’ve seen over the past two weeks,” said Ali.
While this trend has garnered attention, the actual price action in the coming weeks will be crucial in determining whether this signifies a true market low.
Institutional Activity and ETF Flows
Institutional interest in Solana has also seen growth. Upexi Treasury, which manages a significant portfolio of over 2 million SOL, is reportedly raising up to $23 million through private placement. These funds are intended to support its operations and further increase its exposure to SOL.
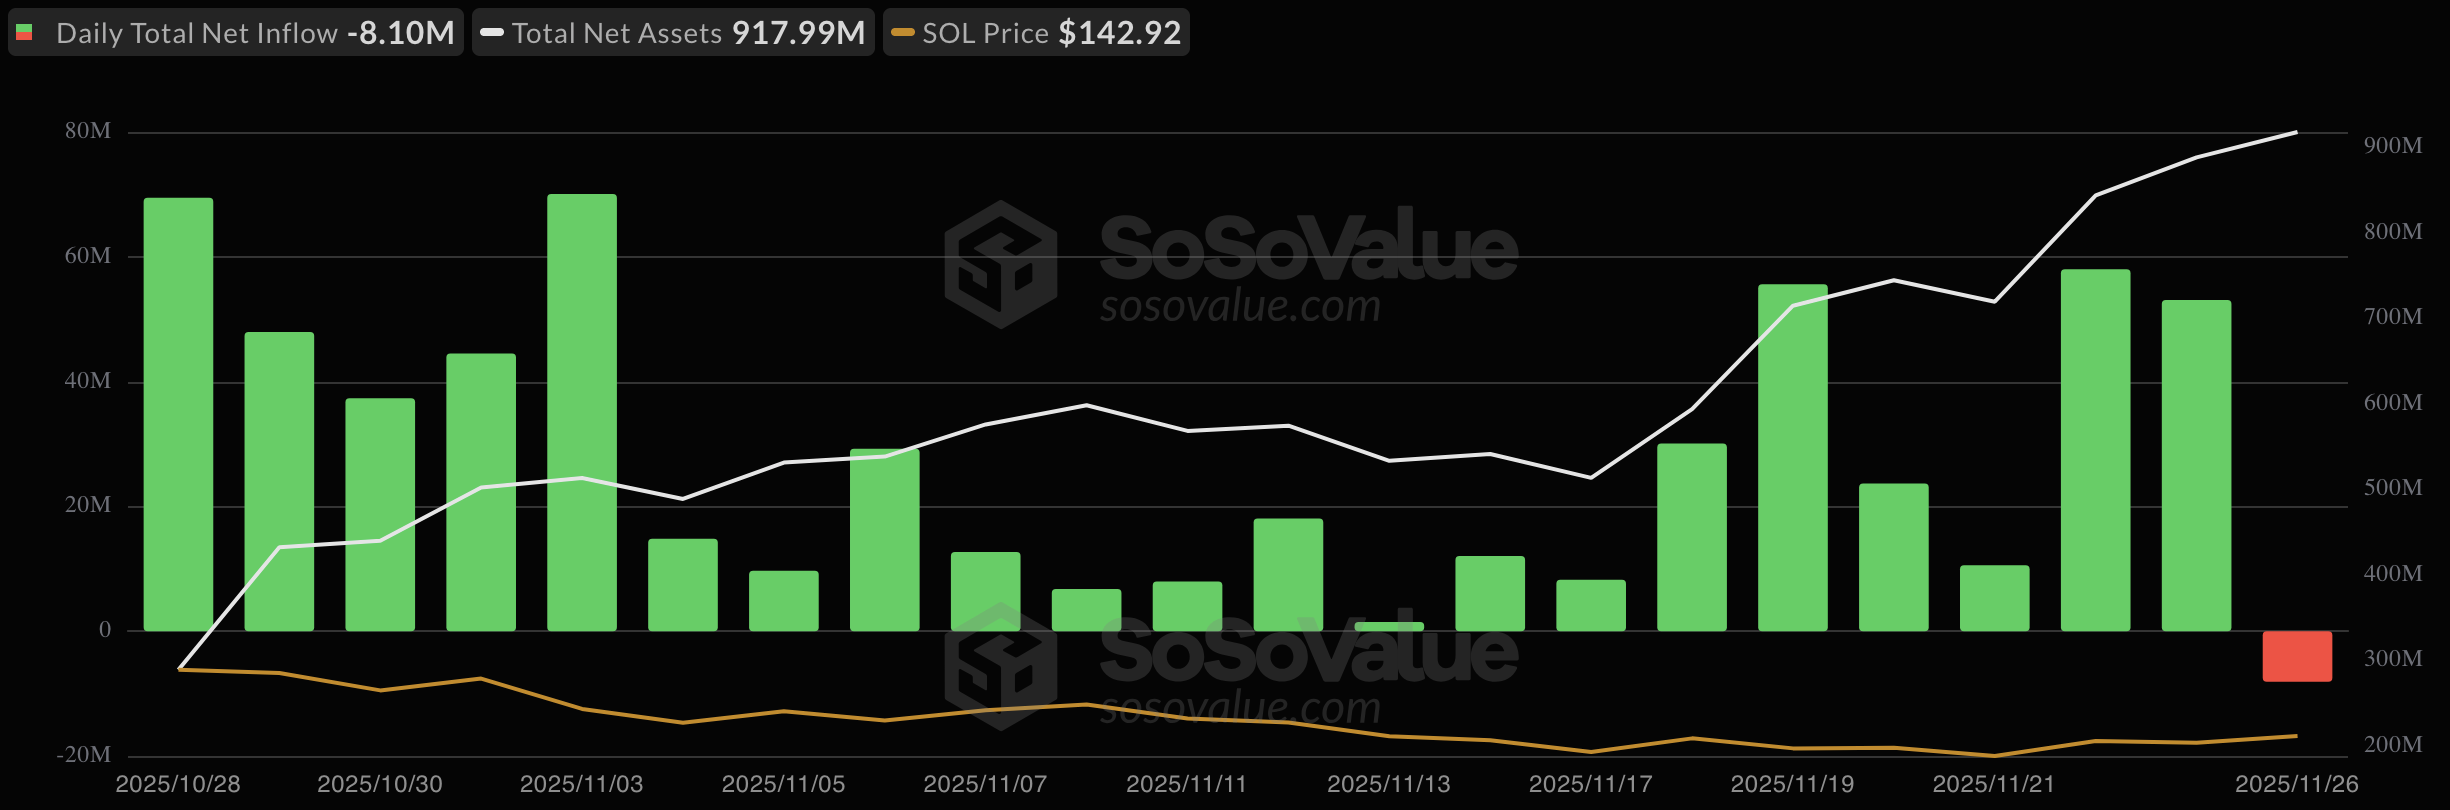
In the realm of Exchange Traded Funds (ETFs), Solana ETFs experienced a strong launch week, attracting $531 million in inflows. This initial success was attributed to attractive 7% staking yields and competitive fees compared to Bitcoin ETFs. However, on November 26, the ETFs recorded their first net outflow, amounting to $8.1 million. Despite this, the total assets under management remain substantial, nearing $918 million.
As previously reported, a spot Solana ETF also received regulatory approval in Hong Kong last month, further indicating growing institutional acceptance and access to the asset.