

Daily Structure and Market Position
Litecoin (LTC) is exhibiting mixed signals on the daily chart, with recent candle closes lacking a clear directional trend. Market activity suggests pressure stemming from weakness in the LTC/Bitcoin (LTCBTC) trading pair, while traders are assessing short-term price movements with Bitcoin dictating the broader intraday behavior.
LTC continues to trade near the established support zone around $80 following an indecisive daily close. This muted reaction reflects unstable momentum, as LTCBTC remains weak and suppresses attempts to build sustained upward movement. The overall trend lacks significant strength until a clear shift appears on higher time frames.
Repeated defenses of the $80 level are evident on the chart, but rebounds consistently falter at the mid-range resistance level of $97. The price is currently situated within a wide consolidation range, leading traders to be wary of undertaking directional trades. This market environment keeps attention focused on lower time frames for more defined price action.
A post from CRYPTOWZRD on X (formerly Twitter) notes that the softness in LTCBTC suggests that additional downside is possible. This commentary emphasizes the importance of closely monitoring Bitcoin's movement, as LTC often reacts to BTC's intraday rhythm. This guidance accurately reflects the present relationship between both markets during periods of indecision.
LTC shows indecision on the daily chart as LTCBTC weakness pressures short-term momentum.
— CRYPTOWZRD (@cryptoWZRD_) June 25, 2024
LTC underperforms BTC on the 24-hour chart, revealing shallow rebounds and stronger volatility.
Traders monitor lower time frames for scalping setups as Bitcoin guides intraday direction.
Lower Time Frame Behavior and Scalp Setups
Short-term price action is characterized by choppy conditions, with LTC trading just above its lower boundary. A move below this level would expose the market to further decline. The initial area of potential recovery is situated around the $91 to $92 region, where earlier price reactions formed intraday pivots. Reclaiming this zone would signal early signs of strengthening market structure.
Until such a recovery occurs, traders continue to look for small rotation opportunities, as outlined in the lower time frame analysis. The projected arrow in the accompanying chart suggests a minor bounce toward mid-range levels. This potential move remains tactical rather than directional, indicating a short-lived reaction rather than a trend reversal.
Scalp setups are heavily reliant on clear reactions at these price boundaries. Given that Bitcoin remains the dominant driver of the broader market, its movement is crucial for timing entries. LTC retains a reactive behavior pattern, making Bitcoin's chart a leading reference for identifying short-term trading opportunities.
Comparative Performance Against Bitcoin
Over the last 24 hours, LTC has displayed wider price swings compared to BTC. The LTC line on the chart indicates early gains that quickly faded due to weak trading volume. BTC's performance has been steadier, remaining near its baseline while LTC has drifted progressively lower.
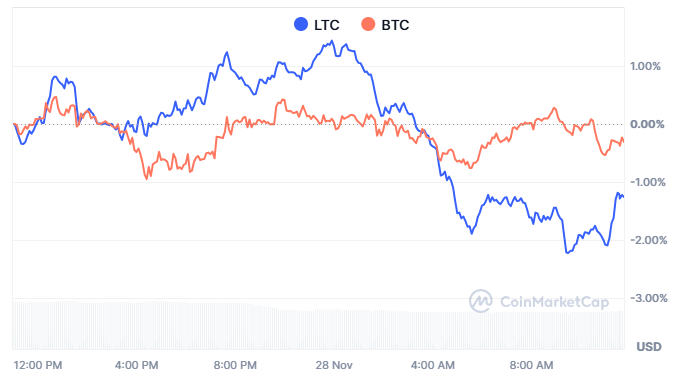
This divergence widened as LTC experienced a sharp drop, losing more than 2% in relative terms while BTC held firm. This move signals specific weakness within LTC rather than broad market pressure. This observation aligns with the ongoing struggle to regain momentum across major price levels.
Recovery attempts for LTC remain shallow, while BTC demonstrates steadier behavior during the same trading window. This pattern reflects current capital preferences, which appear to favor Bitcoin while LTC follows with weaker traction.