

LINK holds a cautious tone as funding rate movement signals reduced leverage pressure across derivatives markets. LINK price trades near key support while intraday action shows soft rebounds and controlled sell-side flow. LINK structure depends on BTC pair strength as traders track trendline pressure into early December.
LINK trades in a compressed structure as traders assess muted funding conditions, fading downside momentum, and cautious intraday buying. The market reflects reduced leverage pressure while price movement holds near an important zone following recent declines.
Daily Structure Shows Caution
LINK remains in a restrained pattern on the daily chart, with recent candles forming near mid-November levels. CRYPTOWZRD described the latest close as indecisive, and the chart supports that reading with compact formations above local support. This behavior often appears when a market is waiting for a clear trigger.

The broader structure places LINK beneath a descending trendline that has shaped its extended downturn. Every prior attempt to reclaim this trendline has failed, keeping the asset within a controlled bearish channel. LINK continues to trade at a distance from this boundary, reflecting a market still testing its footing.
Price behavior shows modest upward movement from the lower zone, though without strong momentum. The market has yet to demonstrate broader buying commitment, leaving LINK in a slow recovery setup. Traders watch LINKBTC closely, as strength in the pair has historically acted ahead of USD movement.
Intraday Action Reflects Gradual Stability
The intraday movement has LINK at $13.49, and it is up by 1.38% in the previous session. The price movement consists of initial declines around the region of $13.31 and then a higher increase indicating there are responsive buyers during a liquidity spike. The rebound formed a rounded high before easing into a controlled retreat.

The later decline in the session remained shallow, indicating that sellers were not establishing strong pressure. The structure stayed intact as the market consolidated below intraday highs. This steady action paved the way for a late-session upward spike that brought LINK back toward the earlier peak.
Market metrics support the observation of lighter resistance. The market cap increased by 1.37% to $9.4B, while trading volume dropped 26.23%. A climbing price paired with reduced volume often indicates a market with limited sell-side activity. Community sentiment registered strong optimism, driven partly by recent ecosystem developments.
Funding Rate Movement Shows Soft Bearish Bias
LINK’s OI-weighted funding rate stayed close to zero through most of the displayed period. The early portion of the data shows alternating readings above and below neutrality, indicating a balanced derivatives landscape. Price during this time remained steady near upper levels.
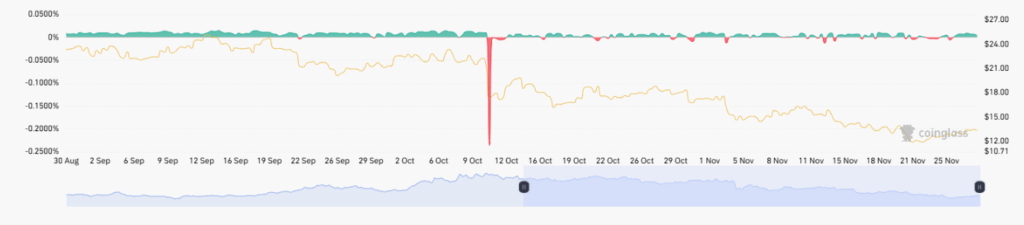
As the period moved toward October, the funding rate drifted slightly negative. These shallow readings between –0.05% and –0.10% reveal more short-leaning positioning but without aggressive leverage. This shift appeared before LINK’s decline from the $24 zone.
A sharp negative spike around October 11–12 marked the most intense short-driven event. After that point, funding stabilized but stayed mildly negative as LINK slid through the $18–$19 region and into the mid-teens. The final stretch showed quiet readings, reflecting a derivatives market waiting for direction.