

LINK remains positioned above a long-observed structural area that has shaped previous market cycles. Recent sessions show the token trading within a controlled range as broader conditions continue to influence short-term movement.
The weekly structure shows slower downside momentum as the token stabilizes above a familiar long-term zone.
Recent sessions show LINK near $13.62 amid broader rotation, reflecting steady but cautious market activity.
Macro Support Returning to Focus
The weekly chart for LINK shows renewed attention on the $9.9–$11.5 macro support range. This area, shared recently by Solberg Invest on social platforms, has been a recurring structural point during extended retracements. The zone has repeatedly appeared after periods of market rotation and broad cooling.
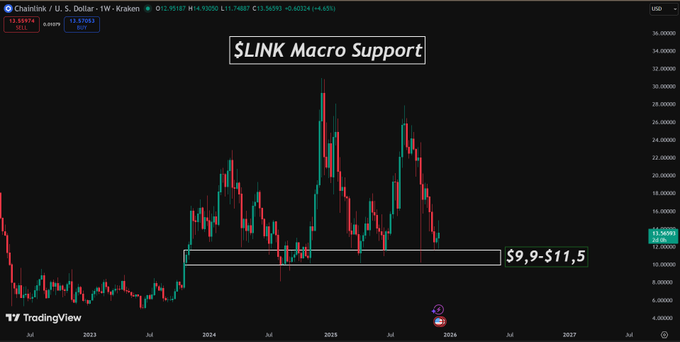
Each historical cycle has seen LINK revisit this support after notable expansions. The chart suggests that retraces often drift back toward this range as the market seeks stability. As a result, the band continues to serve as a long-term reference point for observers studying repeated structural behavior.
Recent weekly candles indicate that LINK is approaching the upper boundary of this area with measured compression. The pattern shows controlled testing, which has been common in previous cycles when the market aimed to locate deeper liquidity. The structural tone remains steady, with no abrupt shifts evident on the higher timeframe.
Market Structure and Recent Price Behavior
LINK trades at $13.62 as of writing, after a 24-hour decline of about 4.2%. The session shows a mix of attempts to reclaim upper intraday levels and ongoing resistance near the $14.20–$14.40 region. The movement reflects a short-term cooling phase within a broader post-retracement environment.
Solberg Invest’s earlier commentary noted that each major retrace tends to reconnect with the macro support band. The current distance from that zone suggests that LINK remains comfortably positioned above its longer-range structural floor. Current trading volume, recorded near $694M, adds context by showing sustained activity even during a corrective period.
Short-term behavior includes repeated stabilization attempts near $13.30–$13.70. This micro-range reflects responsive activity that often appears during market consolidation phases. The consistent reactions within these intervals show measured movement rather than abrupt downturns.
Higher-Timeframe Context and Structural Observations
The weekly structure displays reduced downside momentum compared with previous cycles. The size and duration of recent candles show quieter selling pressure, forming a pattern that observers have seen during earlier phases of market stabilization. This environment continues to draw attention from analysts monitoring cycle-based behavior.
Historical chart symmetry remains present, with strong retraces following major peaks in 2024 and 2025. Each return to the macro support shelf has formed a higher-timeframe base rather than a structural breakdown. This repeated pattern supports continued interest in how LINK behaves around long-term ranges.
Although market participants often reference potential future zones, the key focus remains the immediate structure above $9.9–$11.5. LINK’s current position above that area offers a view of controlled consolidation. Observers continue to track whether weekly compression maintains its pace as the token moves through ongoing market rotation.