

The Render (RENDER) price is currently positioned at a crucial point that could significantly influence its trend throughout 2026. Following an extended period of decline, the price has entered a major support zone that analyst Crypto Patel has been closely monitoring.
Patel suggests that this area will be pivotal in determining whether RENDER initiates a substantial recovery or continues its downward trajectory.
Analysis of the Render Price Chart
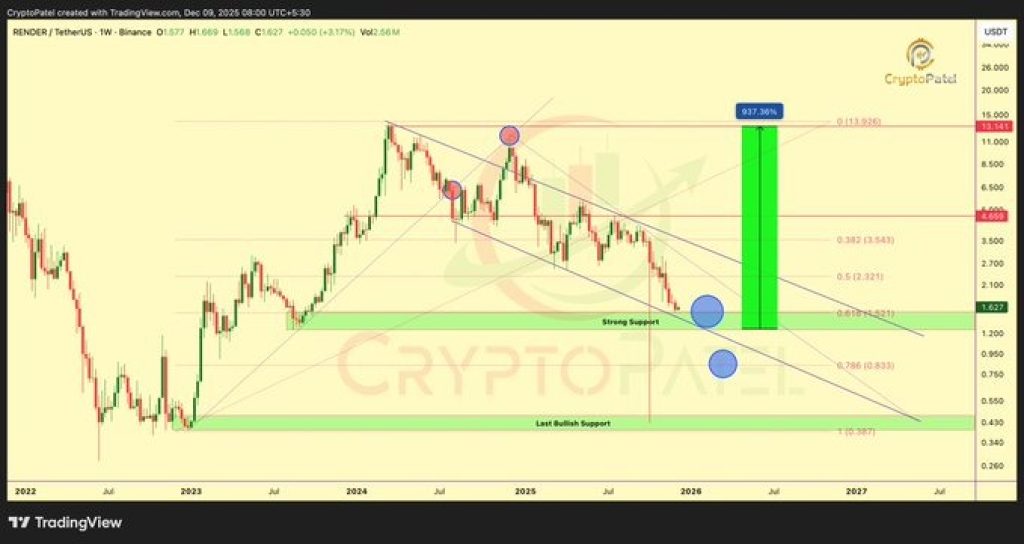
According to Patel's analysis, the RENDER price is currently interacting with the 0.618 Fibonacci retracement zone, which spans between $1.55 and $1.25. Historically, this price band has served as a strong turning point during previous market cycles, and its ability to hold could significantly increase the probability of a reversal.
The chart also reveals a prolonged falling channel that has dictated the entire correction phase. On multiple occasions, the RENDER price has failed to break out of the top of this channel. Currently, the price is situated at the lower boundary of this structure, a level where buyers have previously intervened.
Patel has indicated that if this support zone holds firm, RENDER could potentially embark on a rally towards $4.60, $8, $13, and even $20. These targets align with significant Fibonacci levels and past reaction zones, suggesting a potential for a nearly tenfold increase from its current position.
Conversely, if the support breaks, the RENDER price could decline towards the 0.786 Fibonacci level, approximately $0.84. Patel identifies this level as the "optimal accumulation zone" and the last significant support before the chart faces further weakness.
Significance of the Current Support Level for Render
The price range between $1.55 and $1.25 is critical because it has served as a significant reaction area for traders in earlier market cycles. This zone is often watched by those who may have missed previous entry opportunities, and long-term holders view it as a potential inflection point for trend reversals.
This area also tends to act as a market reset point. Weaker hands may exit their positions, while long-term buyers often step in, leading to increased structural stability.
Should the RENDER price manage to halt its decline at this level and begin establishing higher lows, it could signal the potential end of the current downtrend.
Future Outlook for Render
The upcoming price movements will be crucial in determining whether this support level acts as a springboard for growth or a point of breakdown. A strong bounce accompanied by increasing trading volume would indicate renewed buyer interest. However, a decisive break below $1.25 could pave the way for a further decline towards the $0.84 level.
At present, the RENDER price stands at a pivotal turning point. If the key support zone remains intact, Patel believes the price could be positioning itself for one of its most significant recoveries in recent years.