
Bitcoin appears to be in a state of consolidation. After reaching a peak of $126,296 in late October, BTC has experienced a decline over five weeks, marked by lower highs and lows while testing the $88K–$90K range. This period has led to a souring sentiment and discussions about whether this is the final stage of a bubble. This analysis aims to cut through the hype by examining raw data, including price channels, the Relative Strength Index (RSI), trading volumes, and key price levels. The conclusion is that while short-term exhaustion may signal a bounce, the long-term bullish trend for Bitcoin remains intact.
The Big-Picture Structure: Mid-Cycle Shakeout, Not Bubble Burst
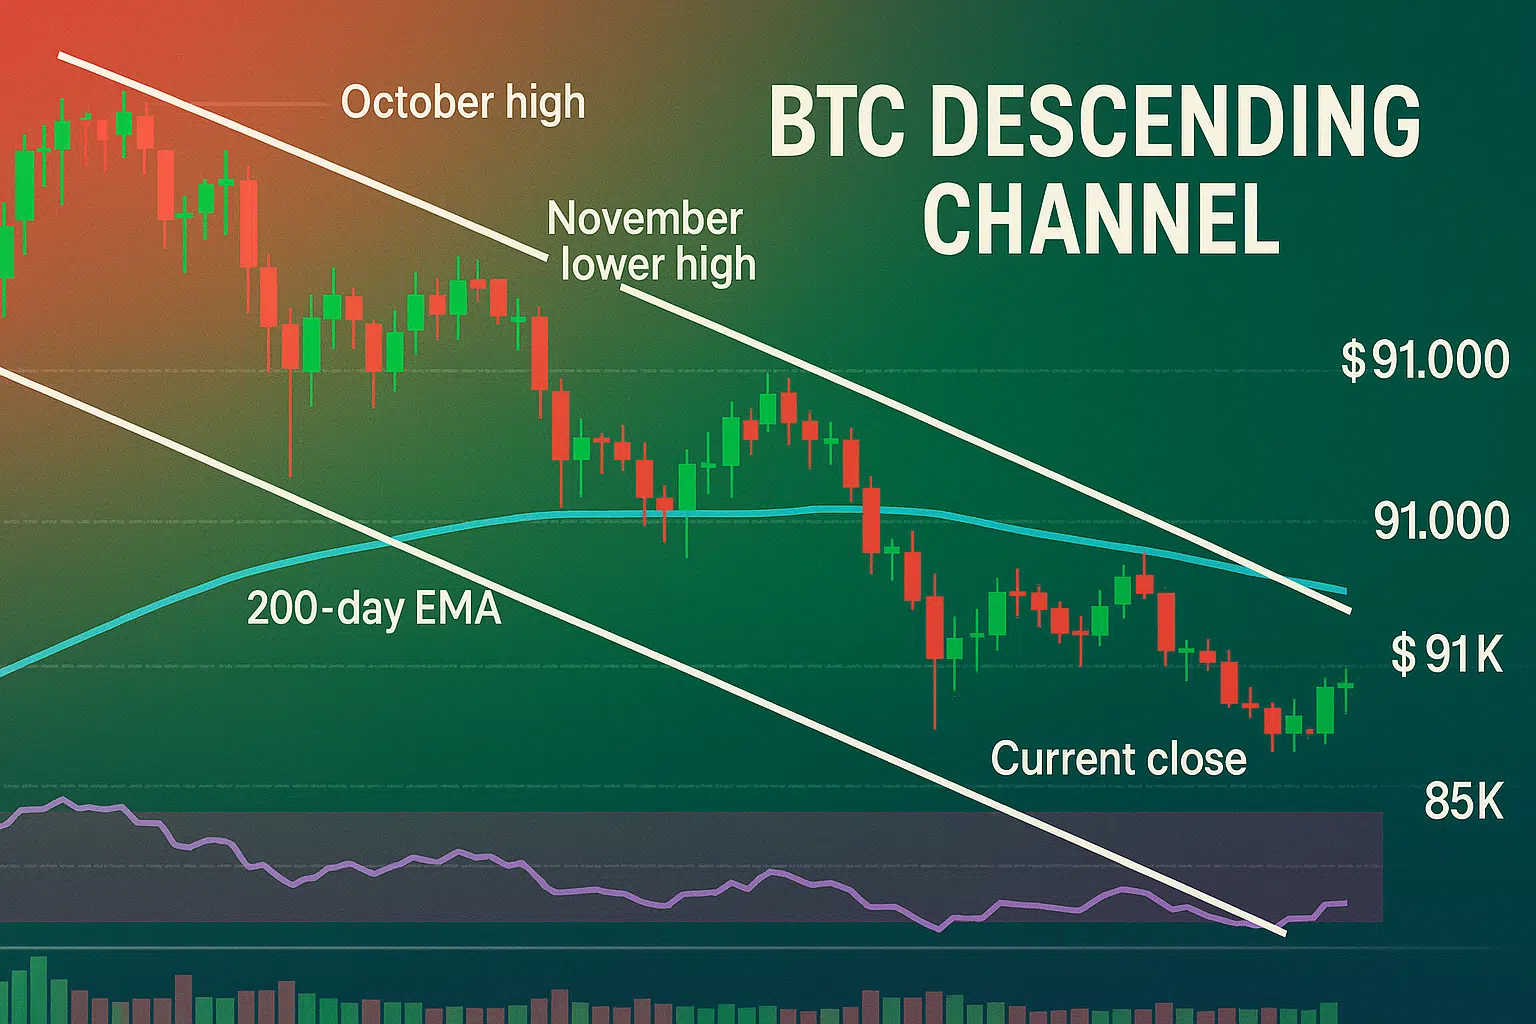
On daily charts, Bitcoin is forming a classic descending channel. Following its peak of $126,296 in October, it dropped to $93,162 on November 28 and subsequently to $94,449 on December 3. The lows have also been descending, from $80,822 on November 21 to $83,871 on December 1. On December 5th, Bitcoin closed at $91,000, representing a 30% decline from its peak.
This pattern is comparable to previous post-halving corrections, such as the 40% drop in 2017 and the 54% drop in 2021. The 200-day Exponential Moving Average (EMA) is currently acting as support at $85,000, with the 0.5 Fibonacci retracement level at $82,000. Buyers have stepped in on each dip. Data from Glassnode indicates that net inflows for this cycle have reached $732 billion, surpassing the combined inflows of all previous cycles.
The verdict is that the market structure remains bullish above the 4-hour timeframe. This period of decline is interpreted not as a collapse, but as a necessary flush to remove weak hands from the market.
RSI: Short-Term Washout, Long-Term Momentum Intact
The Relative Strength Index (RSI) indicates short-term fatigue. In previous significant dips during 2025, the hourly RSI (14) has fallen to cycle lows of 18, which typically precedes bounces of 4–8%. The daily RSI is currently at 48, in neutral territory, following oversold conditions of 36 on December 1. The weekly RSI is at 49, which is well above the 2022 bear market bottom of 25.
Sellers appear to be exhausting themselves. On-Chain Mind reports that the velocity RSI has hit single digits on 3-day charts, a rare occurrence not seen since the bear market of 2022. With a Market Value to Realized Value (MVRV) ratio of 2.1, the data suggests accumulation rather than distribution is taking place. A short-term snap-back rally to the $92K to $94K range is anticipated. The long-term outlook remains positive, indicating a healthy restart for the market.
Volume & Liquidity: Leverage Flush Nears Completion
Trading volumes suggest a period of relief is approaching. The average daily spot volume over the past five days has been $42 billion, a 25% decrease week-over-week. The perpetual futures Open Interest (OI) has compressed by 18% since breaking below $100K. Liquidation heatmaps confirm that pain was concentrated around $96K–$100K for long positions and $88K–$90K for short positions.
Low trading volumes during downside movements combined with shrinking Open Interest indicate that the deleveraging process is nearing completion. Historically, such conditions have preceded significant rallies, similar to the post-flush surges seen in 2021. Total cryptocurrency trading volume stands at $135 billion, which is subdued but showing signs of stabilization.
Furthermore, outflows from Bitcoin Exchange-Traded Funds (ETFs) have eased. While BlackRock's IBIT saw outflows of $113 million on December 4, its net Assets Under Management (AUM) remains at $120 billion, representing 6.5% of Bitcoin's market capitalization. Large holders, often referred to as whales, are observed to be accumulating quietly.
Key Levels: The Lines That Decide December’s Fate
The following price levels are critical to watch for determining Bitcoin's trajectory in December:
- •$94,500: This was the recent lower high established on December 3. A break above this level would flip the short-term structure to bullish, with eyes potentially turning towards $100,000 quickly.
- •$90,000: This is a significant psychological midline. Holding this level suggests the continuation of a choppy, sideways range. A break below could signal further downside.
- •$88,000: This represents immediate daily support. A high-volume close below this level could lead to a retest of the $83K–$85K support zone.
- •$85,000: This level is defined by the 200-day Exponential Moving Average (EMA) and serves as a critical bull market defense line. It has held on every test throughout 2025.
- •$82,000–$80,800: This zone encompasses the 0.5 Fibonacci retracement level and a prior major low. It is considered prime long entry territory, offering the highest risk-to-reward ratio for this cycle.
Upcoming economic events, such as the Federal Reserve minutes and further ETF data, could trigger 4–8% price swings. The market currently anticipates an 87% probability of a rate cut in December.
Key Levels to Watch Right Now: Bitcoin’s Make-or-Break Zones
Here are the precise price zones that will dictate Bitcoin's next significant move:
- •$94,500: This level represents the last lower high, set on December 3. A daily close above this point would invert the entire structure to bullish and open a rapid ascent towards $100,000 and beyond.
- •$90,000: This is both a psychological midpoint and the current center of the trading range. As long as the price remains above this level, we are likely to experience continued choppy consolidation. A decisive break below this point would shift momentum to the downside.
- •$88,000: This is the immediate daily support level. A close below this price on significant volume would trigger a retest of the $83K–$85K area.
- •$85,000: This level is marked by the 200-day EMA and acts as a major line of defense for the bull market. It has successfully held on every test throughout 2025. A break below this point would introduce significant cycle risk.
- •$82,000–$80,800: This zone includes the 0.5 Fibonacci retracement level and a previous major low. It is considered the final shakeout territory and has historically represented the highest probability long entry point of the entire bull run.
These five levels are the most important indicators for Bitcoin's price action over the next two to six weeks; all other price movements are considered noise.
Short-Term vs. Long-Term: Neutral Chop to Bullish Ramp
Short-term (0–14 days): The outlook is neutral to bearish until the $94.5K level is reclaimed. Expect volatility driven by low-catalyst events such as Federal Reserve signals or ETF flows. The current oversold conditions on hourly charts favor an initial bounce to $92K–$94K, but sustained upward movement will depend on broader macroeconomic alignment.
Long-term (Q4 2025–Q1 2026): The long-term outlook remains strongly bullish above the $80K level. On-chain metrics are highly supportive, with over 70% of the supply held by addresses for more than one year, and exchange balances at 5-year lows. The realized cap stands at $1.1 trillion, showing an increase despite recent price dips. Historically, December has shown an average price increase of +9.7%.
The current market sentiment can feel like a deflationary period, but this is characteristic of healthy bull markets. Leverage has been flushed out, and weak hands have been shaken. The upcoming tests around the $90K level will be crucial for determining the next phase.
Final Thoughts
Is Bitcoin's bubble popping at $90K? Based on the available data, the market is undergoing a reset to prepare for the subsequent leg of the bull run. Trading volumes support the interpretation of a leverage flush, the overall market structure remains intact, and the RSI indicates a cooling off period. If Bitcoin holds the $90K level, further gains are expected through 2026. A drop below this level could lead to a parabolic move after a brief scare down to $80K.