

Bitcoin is currently testing a pivotal level that has historically preceded significant market corrections. The 50-week simple moving average (50W SMA), which is now situated near the $102,000 mark, has served as a crucial long-term support line across multiple past market cycles. A failure to maintain this support has frequently led to extended periods of price depreciation.
As of the latest reporting, Bitcoin was trading at $103,000, reflecting a modest 1% increase in the preceding 24 hours. Over the past week, the cryptocurrency has experienced a 7% decline, with its daily trading volume hovering around $61.7 billion.
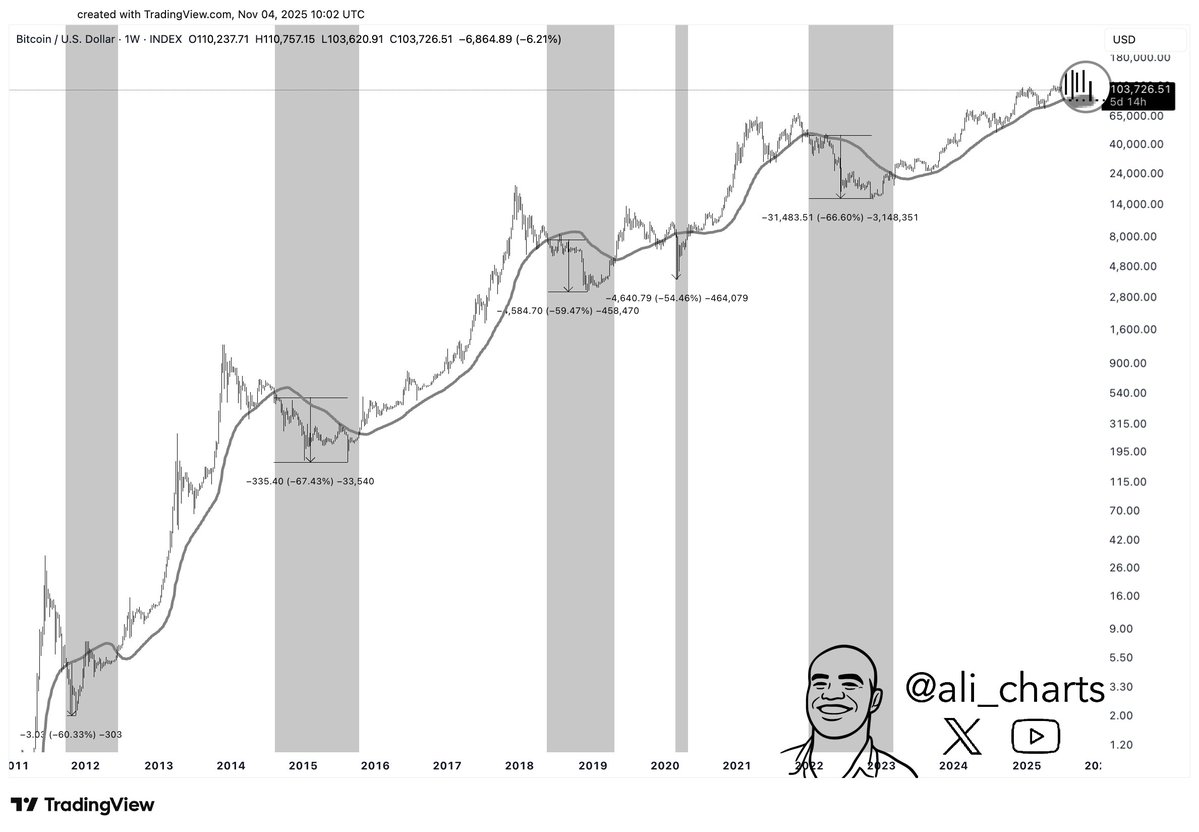
50W SMA and Historical Breakdown Patterns
Historical market analysis reveals a consistent pattern: each instance where Bitcoin has fallen below the 50W SMA has been followed by a sharp market correction. Prominent analyst Ali Martinez highlighted several past occurrences where this support level failed, resulting in significant drawdowns: a 50% drop in 2011, a 67% decline in 2014, a 60% decrease in 2018, and a 66% fall in late 2021. The market crash in 2020, triggered by the COVID-19 outbreak, also saw a 55% decline after a similar breakdown of the 50W SMA.
Bitcoin has seen an average 60% drop each time it has lost the 50W SMA as support.
Based on this historical trend, a confirmed break below the $102,000 level could indicate a potential downward movement toward $40,000. This price point is now being closely watched as a critical determinant of Bitcoin's longer-term market structure.
Key Short-Term Levels and Price Reaction
Analyst Lennaert Snyder has also identified the $102,000 level as a crucial short-term support area that warrants close monitoring. Snyder noted that the 4-hour chart continues to indicate an uptrend and emphasized the importance of holding this level.
I prefer to hold key $102,000 support to not lose the 4H uptrend.
He further indicated that $107,100 represents a significant level for bullish momentum to reclaim.
In parallel, analyst Ted observed that Bitcoin has moved below the 50-period Exponential Moving Average (EMA-50) and underscored the significance of the weekly closing price. He elaborated on the potential implications:
A weekly close below EMA-50 means the dump is just the beginning.
Additionally, key liquidity levels have been noted to reside near $90,000 and $126,000. There is a possibility of a price drop to fill the CME gap before any sustained recovery can occur.
Market Structure, MACD Signal, and Open Interest
Analyst Linton Worm pointed to a confirmed bearish Moving Average Convergence Divergence (MACD) cross, drawing parallels to previous cycle tops. He stated that this signal predicted the crash in 2021 and is now indicating a similar pattern. Worm suggested that if selling pressure persists, $70,000 could become the next significant support level to monitor.
Concurrently, data from Darkfost revealed a substantial decrease in Bitcoin's open interest across major cryptocurrency exchanges. Since October 10, open interest has fallen by more than $10 billion. Binance led this decline with a reduction of $4 billion, followed by Bybit and Gate.io, which saw decreases of $3 billion and $2 billion, respectively. This trend suggests that leverage remains low, and trader confidence appears to be limited as the current market correction unfolds.