

Market Sentiment and XRP's Recent Performance
Ripple's XRP has experienced a challenging period recently, with its price settling near the lower end of its recent trading range. However, this downward movement is not universally interpreted as a bearish signal. Some market analysts suggest that the current correction might be nearing its conclusion.
Veteran financial trader Matthew Dixon has expressed that he sees no immediate cause for a bearish outlook on XRP. He characterized the recent price drop as a typical corrective pattern, rather than the beginning of a more significant decline.
Dixon further noted that despite the panic surrounding MEXC's liquidity concerns, the situation does not resemble the major exchange failures observed in the past.
Technical Analysis of XRP's Chart
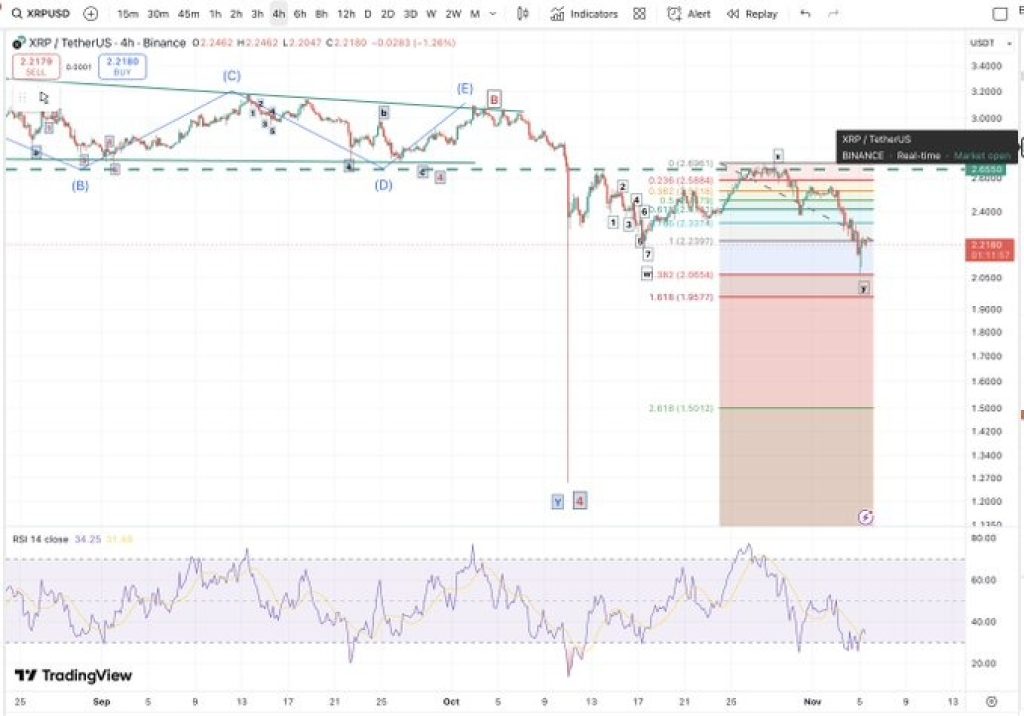
According to Dixon's chart analysis, XRP appears to be following a clear w-x-y corrective pattern. This type of price action is common in markets that require a reset before continuing along their established larger trend.
Dixon believes that XRP has recently completed this corrective phase. Instead of establishing new lower lows, the market found support in a zone similar to where a sharp, panic-driven wick occurred in mid-October.
The Fibonacci retracement levels on Dixon's chart indicate that the price has reacted around the 1.618 zone. This level is frequently identified as a potential end point for corrections within Elliott Wave theory. The observed slowdown in price movement at this level lends credibility to the idea that selling pressure might be diminishing.
A significant portion of the recent market anxiety was fueled by concerns over MEXC's reserves, following reported delays in withdrawal processing.
This led traders to recall the FTX collapse, prompting a cautious reaction. Dixon suggests that this reaction may have been disproportionate, pointing out that MEXC appears to possess sufficient reserves to manage the current situation.
Markets are often prone to reacting more rapidly to fear than to factual developments. If these concerns subside and liquidity is restored, some of the recent sellers might find themselves compelled to buy back into the market.
Current Indicators and Potential Price Movements for XRP
On lower timeframes, the Relative Strength Index (RSI) has been positioned in oversold territory, which typically suggests exhaustion among sellers.
A potential confirmation of a shift in momentum could occur if the XRP price manages to rise back above the short-term resistance level situated between $2.30 and $2.35. The next significant target zone is around $2.50, where selling pressure increased in late October.
For sustained buying interest, XRP would need to hold above its recent low. If this area continues to act as support, the probability of a recovery from the current levels increases. A more substantial downturn would only become likely if Bitcoin experiences another sharp decline.
The current market structure still supports the possibility of a rebound, as the ongoing correction has not fundamentally altered the larger upward trend.
Dixon's perspective remains straightforward: there is nothing in the current technical setup to indicate that XRP's long-term trajectory has failed. The recent price action is viewed more as a reset than a breakdown. The next significant development will depend on whether buyers step in with confidence at the current levels.
Should the market stabilize and focus shift back from exchange-related fears to underlying fundamentals, Ripple's XRP price could regain its upward momentum. For the immediate future, observing how the price behaves around the support levels will provide the clearest indication of the market's next move.