

Technical Setup Suggests a Potential Retracement
The Binance Coin (BNB) chart is exhibiting a technical setup that traders have not observed frequently in recent times, and analyst Batman has drawn attention to it.
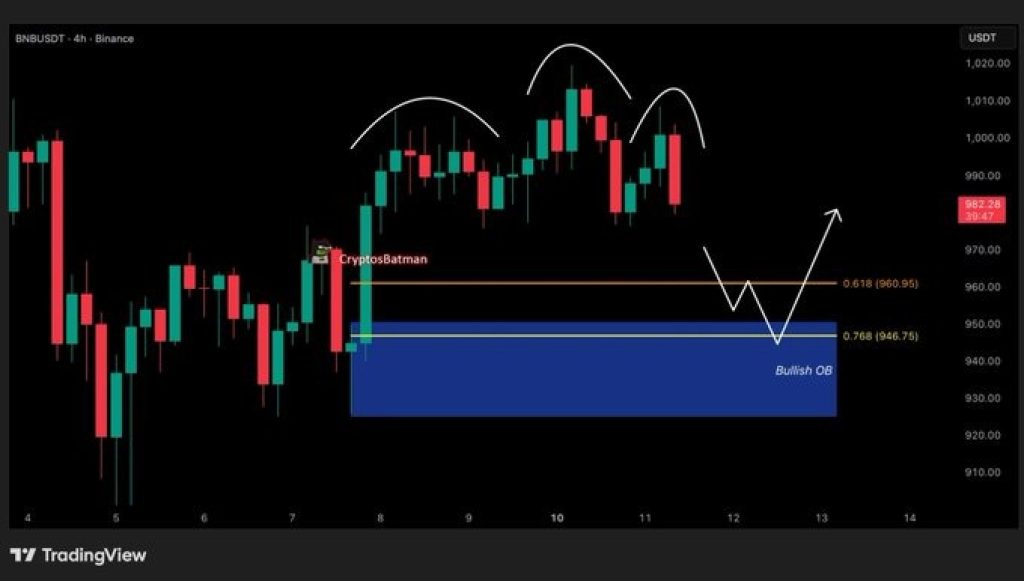
According to his latest analysis, the BNB price is forming a head-and-shoulders pattern on the lower timeframe. This is a widely recognized bearish structure in technical analysis.
Adding to the significance of this pattern is an unfilled Fair Value Gap (FVG) located just below the current price. Batman suggests this gap is acting as a magnet, a notion supported by the chart's behavior.
The confluence of a bearish pattern, an imbalance below the price, and alignment with both a Fibonacci zone and an order block indicates a potential scenario where BNB may need to decrease in value before resuming an upward trend.
Current Chart Observations for BNB
While the BNB price has shown an upward trend over the past few weeks, recent price action suggests a cooling-off period.
The chart clearly displays the formation of a left shoulder, a head, and a developing right shoulder on the lower timeframe. Each attempt to rally has been met with diminishing strength, indicating a potential loss of momentum from buyers.
Directly beneath the neckline lies a distinct Fair Value Gap, the same zone highlighted by Batman. When price leaves such an imbalance, it typically returns to fill it before continuing its established trend.
This FVG is situated in an area the market has not significantly revisited, making it plausible for BNB to retrace into this zone.
The current structure does not appear aggressively bearish, but it does suggest a market inclination towards rebalancing before a definitive directional move.
Furthermore, the closest support level is positioned at the upper boundary of the FVG zone. If the BNB price does retrace into this area, the market's reaction will be critical. A strong bounce would signify that buyers remain in control and that the pattern represents a corrective pullback.
Above the current price, the primary resistance is located where the right shoulder is forming. This level has consistently rejected upward attempts, reinforcing the pattern's structure. If buyers cannot breach this resistance soon, a retracement becomes increasingly probable.
BNB Price Prediction: Future Movements
A dip into the FVG for BNB would align perfectly with a clear Fibonacci retracement level and a nearby order block. Batman identified both of these as potential entry zones, and the chart supports this view, as these areas often serve as strong reaction points in healthy trends.
Should the BNB price find support in this zone, the broader uptrend could persist, and the market might initiate another upward movement. However, if buyers fail to defend this zone, the pattern could lead to a deeper correction, testing subsequent lower support levels.
For the present, the narrative is straightforward. The long-term outlook for the structure is not bearish, but the market appears poised for a reset. A decline before the next significant move might be precisely what BNB needs to regain strength.