

Ripple’s XRP price is currently trading around $2.51 and is experiencing selling pressure following a breakdown in late October. A significant wick down to $1.25 highlighted the rapid disappearance of liquidity during risk-off periods.
The subsequent recovery has been slow and lacks decisive momentum, keeping XRP below the crucial $2.65 resistance level. Market sentiment continues to be shaped by various headlines, including Solana's challenge to XRP ecosystem growth and Flare's ETF filing which boosted the DeFi narrative around synthetic XRP. Institutional accumulation, such as Virtu Financial's holdings, provides support for longer-term confidence despite recent profit-taking.
XRP Price Chart Analysis
The 4-hour chart shows tight price compression between $2.40 and $2.65. Every attempt to move higher has been rejected before reclaiming the $2.70 zone. The lower highs observed since October 25 indicate cautious sentiment, while buyers continue to step in near $2.40, establishing a defined range.
A significant imbalance remains from the mid-October crash, which has not been fully retraced and continues to cap momentum. A sustained close above $2.65 would signal renewed confidence and could lead to a quick target of $2.80.
Conversely, if XRP price loses the $2.40 support, the chart structure suggests a deeper test toward $2.25, where heavier demand was observed earlier in October.
Trading volume has remained thin throughout the recovery, and the absence of aggressive follow-through indicates market hesitation. The current chart pattern suggests a neutral consolidation phase with no clear breakout direction confirmed yet.
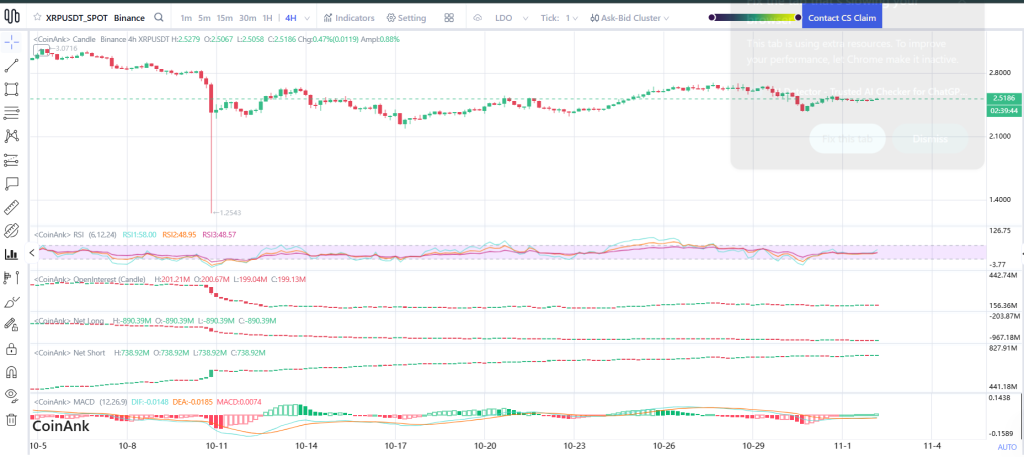
Market Indicators
The Relative Strength Index (RSI) is hovering between 45 and 50, reflecting balanced momentum. This suggests a potential for sideways movement throughout the week unless a significant catalyst emerges.
The Moving Average Convergence Divergence (MACD) indicator is situated near the zero line and remains flat. The convergence of the signal and baseline lines indicates that neither buyers nor sellers currently hold a significant momentum advantage.
Open interest has seen a sharp decline since October 9. This reduction in leverage implies fewer forced liquidations but also suggests weaker directional conviction in the market.
Net long and net short positioning exhibit minimal spread, reinforcing the observation that traders are awaiting a breakout trigger before committing to a directional bias.
These indicators collectively paint a picture of a market pause following a period of volatility. Market participants appear to be waiting for the chart to provide a clearer indication of the next move.
XRP Price Short-Term Outlook
For XRP to shift into a bullish continuation, it must reclaim the $2.65 level with strong demand. A breakout above this resistance could re-target $2.80 and subsequently $3.00, contingent on an expansion of liquidity from institutional desks.
As long as XRP price remains capped below $2.65, sellers maintain an advantage, and the cryptocurrency could retest lower support levels.
A move below the $2.40 support level could quickly lead to a retest of $2.25. If this level fails to hold, the market may revisit the liquidity pocket closer to $2.10, which has historically attracted buyers and could do so again if sentiment deteriorates.
Ongoing scrutiny over XRP's adoption and competition from faster settlement chains continue to present headwinds. However, institutional positioning and improved regulatory clarity provide a stronger long-term foundation for the asset.
The near-term direction will largely depend on whether buyers successfully defend the current range or step aside, allowing for a further price decline.
Stability above the $2.50 mark keeps the possibility of a breakout open. A weekly close above $2.65 would signify a shift from recovery to renewed upward momentum.