

Solana is concluding a busy October, a month that saw the SOL price attempt to push higher but struggle to maintain levels above the $230–$240 zone. A market-wide pullback at the end of October resulted in a roughly 6% drop for SOL, bringing it back towards a significant support area near $180.
Despite this recent sell-off, Solana continues to attract considerable institutional interest. The recently launched U.S. ETF recorded the highest opening-day volume of the year, with $56 million traded. Furthermore, Western Union's exploration of a Solana-based stablecoin highlights growing real-world adoption for the network.
However, ongoing macroeconomic pressures, particularly concerns surrounding U.S. interest rates, are contributing to high volatility as the market heads into November.
SOL Chart Analysis: Testing Critical Support
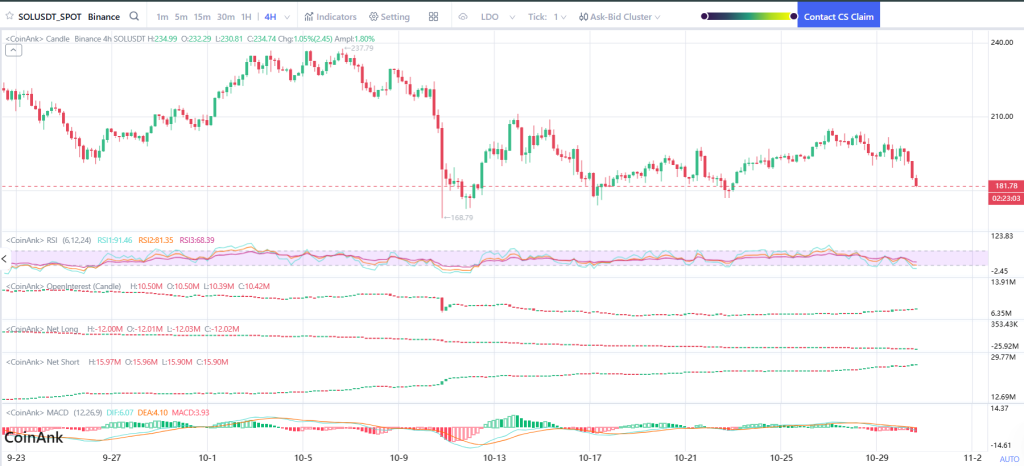
The 4-hour chart indicates a gradual downward trend for the SOL price following its failure to break above $240 for a second time this month. Sellers became aggressively active at that resistance level, and the latest decline has pushed the price directly onto the $180–$185 support band. This is the same zone where buyers provided strong defense during mid-October.
While the overall trend remains bullish on higher timeframes, the current short-term structure could shift into a lower-high pattern if this support fails. Consequently, the current level is a critical pivot point for Solana's price movement in November.
Market Indicators: Mixed Signals
The Relative Strength Index (RSI) has experienced a sharp decline from overbought territory and is now closer to a neutral range, suggesting the market may have reset from the prior rally and could be poised for a bounce.
The Moving Average Convergence Divergence (MACD) has turned red again, signaling a slowdown in momentum. However, it has not yet indicated a full bearish divergence breakdown.
Open interest saw a slight dip during the recent correction, but liquidity remains high, indicating that traders have not abandoned their positions. Net short positioning has increased during this decline, which could potentially fuel a sharp rebound if the SOL price stabilizes and squeezes these shorts.
November Price Outlook for Solana
Solana's price trajectory in November will likely depend on how it performs at the current support level. If buyers successfully defend the $180 region, similar to last month, the price could consolidate and make another attempt at the $230–$240 resistance range.
A decisive break above this resistance zone would signify a continuation of the bullish trend and potentially open the path towards the $260–$280 zone later in the month.
Conversely, if the $180 support level breaks with significant volume, momentum could turn bearish, leading to a deeper pullback towards the $165–$170 region before any recovery attempt is made.
Despite macroeconomic concerns, the successful ETF launch and the increasing utility of stablecoins on the network remain strong positive factors for Solana. The current chart pattern is not broken; it is merely testing a crucial support level.
Holding the $180 support line could quickly restore confidence in the market. Failure to maintain this level might lead buyers to step back until broader market conditions improve.
Currently, the market is closely watching this support zone, as the next significant price move will set the tone for the remainder of the month.
Related Content and Resources
Subscribe to our YouTube channel for daily crypto updates, market insights, and expert analysis.