

What the XRP Chart Is Showing
Looking at the 4H chart, XRP price is clearly coiling up for its next move. After rallying to $3.66, the price retraced and has been trading in a wide consolidation range between $2.80 and $3.10.
This setup is typical of a market preparing for a breakout. The $3.03–$3.10 region remains tough resistance; a neat close above it would drive XRP quickly to $3.30–$3.40. But if the bulls lose momentum and the price falls below $2.80, the next important support remains down at $2.20.
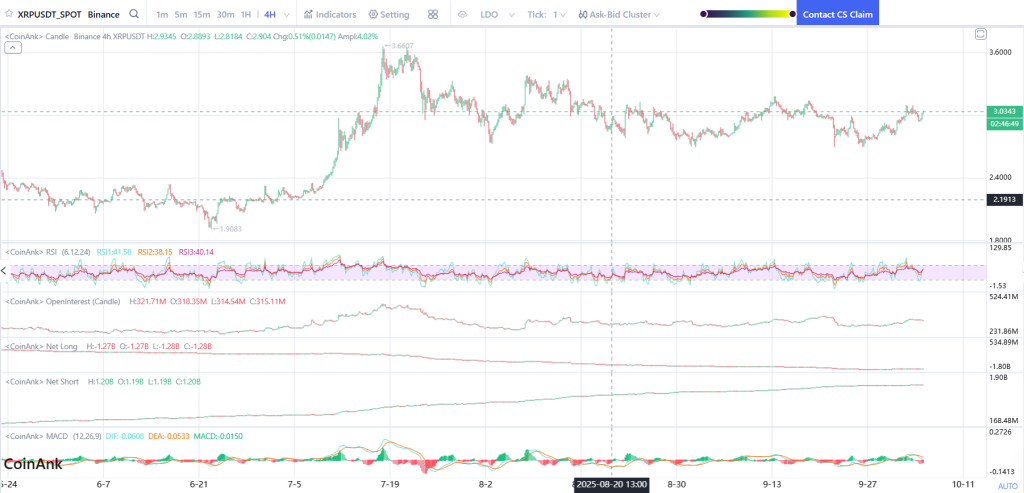
Momentum indicators are showing a neutral tone. The RSI is near 40, suggesting there’s room for a move in either direction, and the MACD is flattening, which usually means the market is catching its breath. Overall, the chart shows consolidation rather than weakness, XRP is waiting for a trigger.
Market Indicators
On-chain data shows that both long and short positions are balanced, with net longs around $1.27 billion and shorts just below that. Traders are clearly cautious, unwilling to overcommit ahead of the ETF headlines expected in mid-October.
Open Interest also fell slightly to $315 million, which is something that typically happens when profit‑taking comes in.
Momentum stays steady, volatility is subdued, and that kind of calm never lasts for long in crypto. The minute a catalyst triggers, volatility comes to life, and that could happen sooner than later with XRP.
XRP Price Short‑Term Outlook for the Week
At writing, XRP is sitting in a tight range around $2.90–$3.00. The key level to watch is $3.03. If the bulls manage to break through that zone with strong volume, the stock can retest $3.40 quite quickly and even $3.66.
But if ETF optimism fades or whale selling intensifies, a drop back toward $2.70–$2.80 wouldn’t be surprising fpr XRP price. Until then, the market seems content to wait, calm before what could be XRP’s next big move.