

Ripple's XRP is currently trading around $2.05, maintaining a position just above a significant level that has been influential throughout the week. In the previous analysis, the focus was on $2.00 as the critical line for preserving the short-term structure, a prediction that has held true.
The XRP price has remained above $2.00, experiencing an upward movement mid-week and briefly reaching $2.20 before a subsequent pullback. This price action confirmed demand below $2.00, even though the breakout was not sustained.
The primary question now is the future direction of the XRP price.
Factors Influencing XRP's Current Price
Market flows continue to be a pivotal factor. U.S. spot XRP ETFs now manage approximately $1.56 billion in assets, with average daily inflows around $10.6 million. Notably, Franklin Templeton's XRPZ ETF alone saw inflows of roughly $28.6 million within a single week in January. These consistent inflows are important as they help to absorb the available supply of XRP.
Concurrently, Ripple continues to sell approximately $200 million worth of XRP each month to finance its operations, which introduces a steady supply overhang. For the XRP price to achieve sustained upward trends, ETF inflows must consistently exceed these sales. A slowdown in inflows could increase the likelihood of downward price tests.
On-chain data and positioning metrics provide further insight. Last week, large XRP holders accumulated over 50 million XRP during periods of sideways trading near the $2.00 mark. Exchange data indicated daily net outflows of around $13.1 million, which contributes to reducing immediate selling pressure. However, derivatives positioning appears stretched. On Binance, the long/short ratio is hovering near 3.0, indicating a strong market inclination towards a bullish outlook. While this can fuel upside momentum, it also elevates the risk of sharp pullbacks if the price begins to decline.
XRP Chart Analysis
An examination of the XRP chart reveals that the price action remains within a defined range. The $2.00 level continues to serve as robust support, with buyers consistently stepping in near this price point, preventing a breach lower.
On the upward trajectory, $2.20 represents the initial resistance level to monitor. This level previously rejected price advances earlier in the week. A move above $2.20 would target the $2.30 area, which aligns with previous supply zones and would likely necessitate strong momentum to overcome.
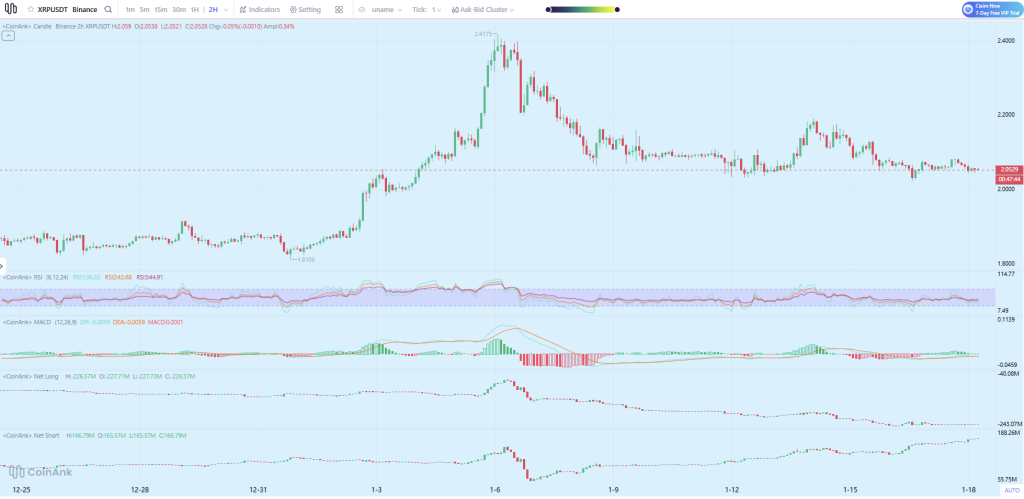
Momentum indicators suggest consolidation rather than a clear trend in either direction. The Relative Strength Index (RSI) is positioned in the mid-30s to low-40s, indicating neither an oversold condition nor significant strength. The Moving Average Convergence Divergence (MACD) is flat and near the zero line, signaling market indecision. Net long positions remain elevated relative to net shorts, which supports the current range but heightens volatility risk should support falter.
In summary, the chart indicates a state of balance. Sellers are active above $2.20, while buyers are demonstrating activity near $2.00.
XRP Price Prediction for This Week
As long as the $2.00 support level holds, the near-term outlook remains neutral to slightly bullish. Under these conditions, the XRP price could potentially make another attempt towards the $2.15–$2.25 range. A clear break and sustained hold above $2.20 would open the possibility of reaching $2.30, though further upward movement would depend on continued ETF inflows and stable broader market conditions.
Should the $2.00 level fail on a closing basis, the downside risk would increase significantly. The next support level is situated near $1.80, a point that could attract buyers again but would reset short-term sentiment.
For the present, the most probable scenario involves continued range trading between $2.00 and $2.20. The future direction of the XRP price will hinge on which of these levels breaks first and whether market flows can adequately absorb the available supply.