

Pump.Fun price has been steadily increasing following a dip last week, capturing the attention of traders once again. The price is currently trading around $0.004814, with chart structure indicating a consistent recovery on lower timeframes.
After trading sideways for most of October, PUMP began to gain momentum as trading volume on order books returned.
Significant fundamental developments have also occurred. A substantial whale withdrew 1.29 billion PUMP from Binance, increasing their total holdings to 3.3 billion over the past two weeks.
Additionally, Pump.fun's buyback program has now surpassed $150 million, resulting in the removal of nearly 10% of the total supply. The acquisition of Padre also made an impact, as the platform integrated the trading terminal and announced a compensation snapshot for PADRE holders.
The PUMP price is currently testing the resistance level around $0.0052. A reversal at this level could potentially lead the price towards the $0.0060 to $0.0075 region, based on order book liquidity. This is a critical juncture that could trigger short-term volatility.
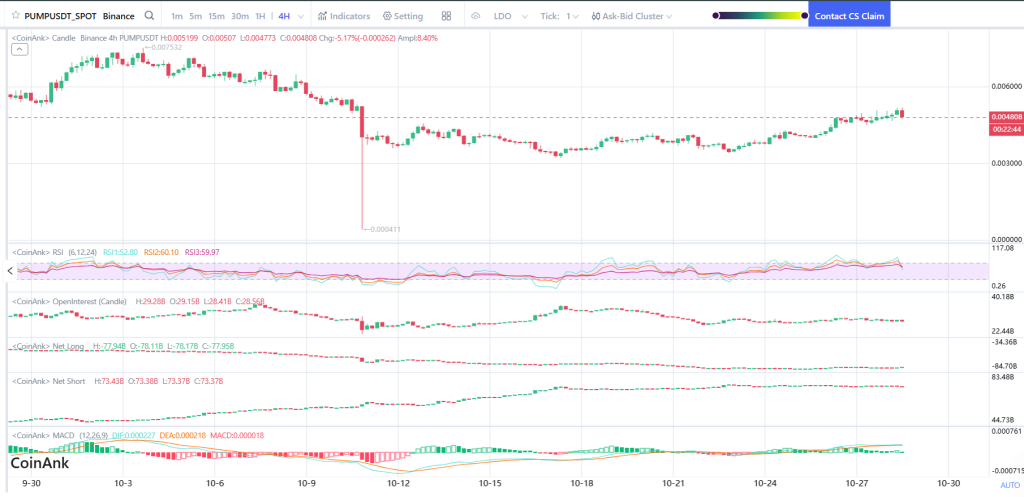
PUMP Chart Analysis
On the 4-hour chart, Pump.Fun price is advancing into a distinct resistance zone after a clear bounce from the lower channel boundary near $0.0041. The candles are gradually closing higher, signaling renewed buyer interest after weeks of exhaustion.
The downtrend that had previously suppressed the price until mid-October has weakened, and current price action suggests sellers are finding it difficult to push the price lower.
The last downward movement resulted in a long wick, often indicative of capitulation from short sellers. Since then, PUMP price has reclaimed the mid-range, which typically serves as a staging area before an upward attempt. As long as the price continues to print higher lows, this bullish setup remains valid.
Market Indicators
The Relative Strength Index (RSI) is positioned in the mid-50s, indicating a neutral but upward-trending momentum. This is an optimal position before a breakout, allowing buyers ample room for upward movement.
Open interest has been steadily increasing, suggesting traders are re-entering positions without overheating the market. Net shorts are gradually decreasing, while net longs are building at a pace that indicates confidence without excessive leverage.
The MACD histogram has begun to turn green, and both MACD lines are curling upward. This pattern often precedes a significant price move and signals an early trend shift.
When momentum, volume, and chart structure align in this manner, the probability of upside price action tends to increase.
PUMP Price Short-Term Outlook for Q4
If PUMP can achieve a decisive close above $0.0052, the next upward movement could accelerate more rapidly than anticipated. The thin liquidity above this level means that minimal buying pressure can push the price into the next significant pocket near $0.0060. Once traders observe increased velocity, speculative volume typically follows. The $0.0075 region emerges as the next key area of interest if momentum continues to build.
Conversely, if buyers fail to sustain this breakout attempt, attention should be directed towards the $0.0041 support area. This zone has proven to be a strong support level twice previously. A breach of this level would disrupt the bullish structure and could initiate another period of consolidation.
The market sentiment appears more bullish today. Buybacks are reducing supply, whales are accumulating assets, and the overall atmosphere is building positively. Coupled with healthier market indicators and an improving 4-hour chart structure, PUMP price seems better positioned heading into November than it has been in the past three weeks.
As is common in this market, momentum can shift swiftly. However, for the present moment, price action is leaning towards an upward trend, and traders will be closely observing to see if PUMP can successfully break through its current ceiling.