

Kaspa is trading around $0.044 at press time, holding the crucial support level identified in last week's outlook. In the previous Kaspa price prediction, the focus was on maintaining the $0.044–$0.045 support zone to limit downside risk and keep the structure constructive.
This scenario has largely played out as expected. Kaspa briefly rallied toward $0.050 mid-week, indicating continued buyer interest during dips. However, this upward momentum lacked sustained follow-through, and the price has since retreated into its established range. This leaves the short-term question unresolved: will Kaspa defend its support again, or will selling pressure eventually drive the price lower?
Factors Shaping the Kaspa Price
A significant structural factor for Kaspa is its emission schedule. By July 2026, approximately 95% of KAS's 28.7 billion maximum supply will have been mined. Miner rewards are currently around 55 KAS per block, with emissions decreasing by about 5% each month.
This reduction in emissions gradually lessens sell pressure from miners, which can contribute to market stabilization over time. However, the mining landscape is increasingly dominated by ASICs, with the network's hash rate hovering around 210 EH/s. This raises concerns about centralization and closely ties mining profitability to the price. For many miners, maintaining the KAS price above $0.04 is essential for economic viability after accounting for energy costs.
In terms of ecosystem development, Kaspa has launched K-Social, a decentralized social platform built directly on its blockchain. This platform stores posts, profiles, and interactions on-chain, with transaction costs measured in fractions of a cent. While K-Social may not immediately impact Kaspa's price, it reinforces Kaspa's positioning as a fast, low-cost network focused on genuine on-chain activity rather than solely speculation.
Kaspa Chart Analysis
Analysis of the KAS chart reveals that Kaspa remains within a broad consolidation pattern that has characterized most of December and January.
Support is firmly established in the $0.044–$0.045 zone. This area has been tested multiple times and continues to attract buying interest. A clear break below $0.044 would expose the next downside target near $0.040, which represents the prior local low.
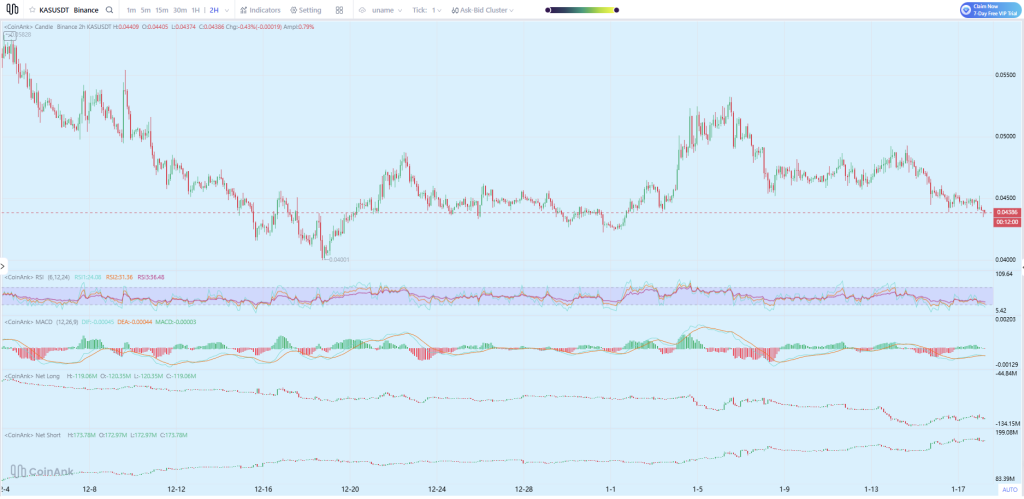
On the upside, resistance is layered. The initial barrier is located around $0.048–$0.050, the level where last week's rally encountered resistance. A decisive move above $0.050 would shift short-term momentum and could open the path toward $0.055, though this would likely depend on broader market strength.
Momentum indicators reflect the current range-bound environment. The RSI is positioned in neutral territory, indicating neither oversold nor overbought conditions, which aligns with the sideways price action. The MACD remains flat, showing no strong bullish or bearish crossover, suggesting a lack of conviction from either side of the market.
Positioning data offers an interesting perspective. Net longs have seen a gradual decline, while net shorts continue to accumulate. This indicates growing bearish sentiment, which could potentially increase volatility if the price experiences a sudden upward movement, triggering short covering. For the time being, however, short positions appear to be sustained as long as the KAS price remains capped below resistance levels.
Kaspa Price Prediction for This Week
In the short term, the Kaspa price outlook is cautious yet stable.
As long as the $0.044 support level holds, Kaspa is likely to continue trading within its established range, with potential for rebounds toward the $0.048–$0.050 resistance area. A daily close below $0.044 would weaken the current structure and increase the risk of a downward move toward $0.040.
Conversely, a sustained break above $0.050 would signal a clear shift in momentum and could quickly propel the Kaspa price into the mid-$0.05 region. Until such a breakout occurs, patience is advised.
Currently, Kaspa's market behavior is characterized by consolidation rather than a clear directional trend. The next significant price movement is anticipated to occur once the price breaks out of this range, compelling both long and short positions to re-evaluate their strategies.